Graphics Reference
In-Depth Information
surf(X,Y,Z),view(-90,0)
subplot(2,2,3)
surf(X,Y,Z),view(60,30)
subplot(2,2,4)
surf(X,Y,Z),view(-10,30)
Figure 5-26.
Then MATLAB reads a file and appropriate properties are used to generate the colorful graph in Figure
5-27
.
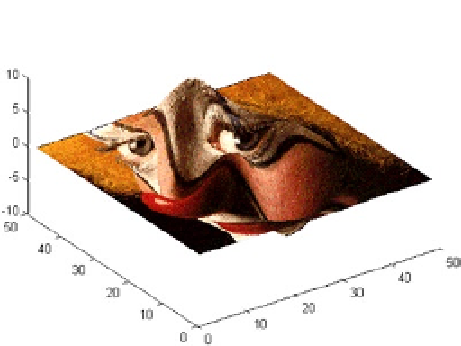
>> load clown
surface(peaks,flipud(X),...
'FaceColor','texturemap',...
'EdgeColor','none',...
'CDataMapping','direct')
colormap(map)
view(-35, 45)
Figure 5-27.