Graphics Reference
In-Depth Information
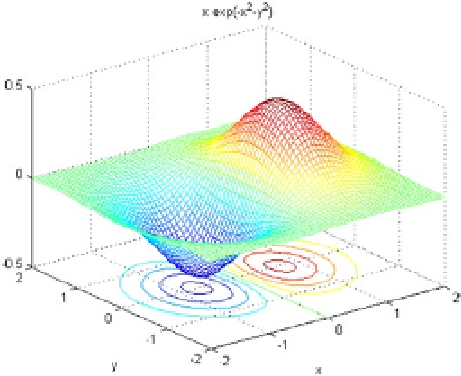
We can make the mesh-contour chart simultaneously (Figure
5-23
) as follows:
>> ezmeshc('x * exp(-x^2-y^2)', [- 2, 2], [- 2, 2])
Figure 5-23.
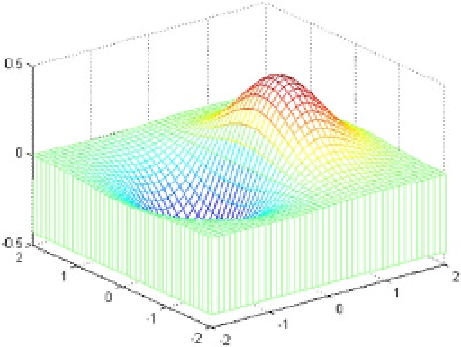
We can also represent the mesh graph with the option of curtain or curtain bottom (Figure
5-24
) as follows:
>> [X, Y] = meshgrid(-2:.1:2,-2:.1:2);
Z = X .* exp(-X.^2-Y.^2);
meshz(X, Y, Z)
Figure 5-24.