Graphics Reference
In-Depth Information
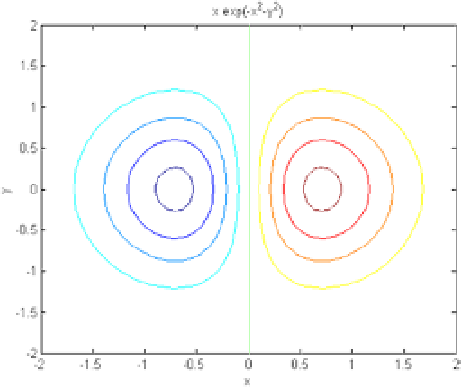
the contour graph (Figure
5-21
) can be represented as follows:
>> ezcontour('x * exp(-x^2-y^2)', [-2, 2], [-2, 2])
Figure 5-21.
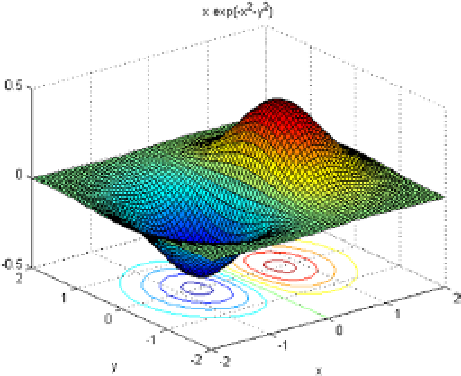
We can make the graph of the surface and contour simultaneously (Figure
5-22
) as follows:
>> ezsurfc('x * exp(-x^2-y^2)', [- 2, 2], [- 2, 2])
Figure 5-22.