Graphics Reference
In-Depth Information
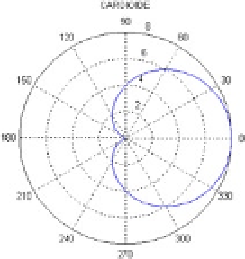
eXerCISe 5-3
represent the polar curve
r
= 4 (1 +
Cos
(
a
)) between 0 and 2
p
(cardioid). also represent the curve in polar,
r
= 3
a
for
a
between - 4
p
and 4
p
(spiral).
the first curve (Figure
5-16
) is represented using the following syntax:
>> a = 0:0.01:2*pi;
r = 4 * (1 + cos(a));
polar(a, r)
title('CARDIOID')
Figure 5-16.
the second curve (Figure
5-17
) can be represented using the syntax:
>> ezpolar('3*a',[-4*pi,4*pi])
Figure 5-17.