Graphics Reference
In-Depth Information
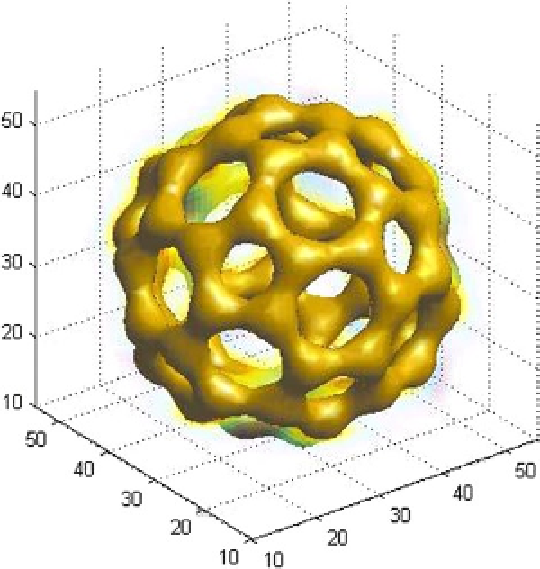
Figure
1-7
shows a three-dimensional diagram of an isosurface that reveals the GEODESIC domed structure of a
fullerene carbon-60 molecule.
Figure 1-7.
MATLAB includes interactive tools for design and graphics editing. From a MATLAB diagram, you can perform
any of the following tasks:
•
Drag and drop new sets of data in a figure
•
Change the properties of any object in the figure
•
Change the zoom, rotation, add a panoramic view, or change the camera angle and lighting
•
Add data labels and annotations
•
Draw shapes
•
Generate a code M file that represents a figure for reuse with different data
Figure
1-8
shows a collection of graphics, created interactively by dragging data sets onto the diagrams window,
creating new subdiagrams, changing properties such as colors and fonts and adding annotations.