Graphics Reference
In-Depth Information
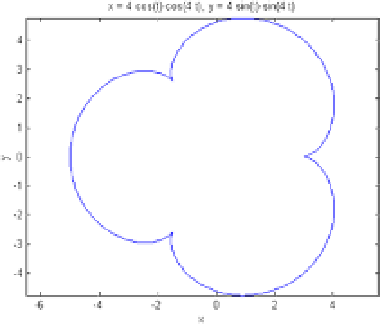
Figure 5-5.
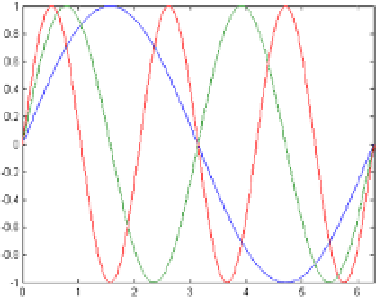
Next, were present the curves
Sine
(
x
),
Sine
(2
x
) and
Sine
(3
x
) about the same axes as shown in Figure
5-6
.
The syntax is as follows:
>> fplot('[sin(x), sin(2*x), sin(3*x)]', [0, 2*pi])
Figure 5-6.
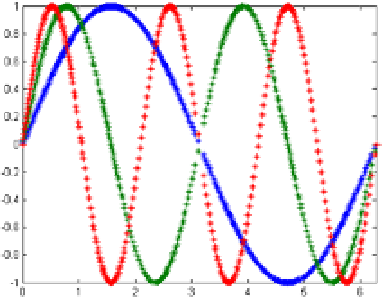
We can try to represent every previous curve using different strokes (Figure
5-7
) by using the following syntax:
>> fplot('[sin(x), sin(2*x), sin(3*x)]', [0, 2*pi],'*')
Figure 5-7.