Graphics Reference
In-Depth Information
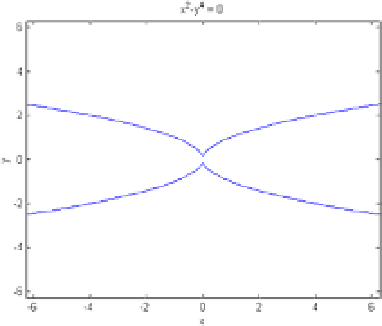
Figure 5-3.
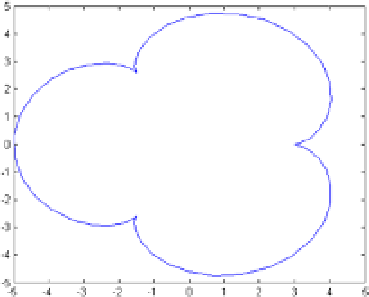
Then we graph the parametric curve-
x
(
t
) = 4
cos
(
t
) -
cos
(4
t
),
y
(
t
) = 4
sin
(
t
) -
sin
(4
t
) varying
t
between 0 and 2
p
(Figure
5-4
). The syntax is as follows:
>> t = 0:0.1:2*pi;
>> x = 4 * cos(t) - cos(4*t);
>> y = 4 * sin(t) - sin(4*t);
>> plot(x,y)
Figure 5-4.
The same graph (Figure
5-5
) could have been obtained by using the following syntax:
>> ezplot('4*cos(t) - cos(4*t)', '4*sin(t) - sin(4*t)', [0, 2*pi])