Graphics Reference
In-Depth Information
1.1.3 Data Visualization
All graphics functions necessary to visualize scientific and engineering data are available in MATLAB. MATLAB
includes features for representation of two-dimensional and three-dimensional diagrams, three-dimensional volume
visualization, tools to create diagrams interactively and the possibility of exporting to the most popular graphic
formats. It is possible to customize diagrams adding multi-axes, change the colors of the lines and markers, add
annotations, LaTeX equations, legends and other plotting options.
Vectors functions represented by two-dimensional diagrams can be viewed to create:
•
Diagrams of lines, area, bars and sectors
•
Direction and velocity diagrams
•
Histograms
•
Polygons and surfaces
•
Dispersion bubble diagrams
•
Animations
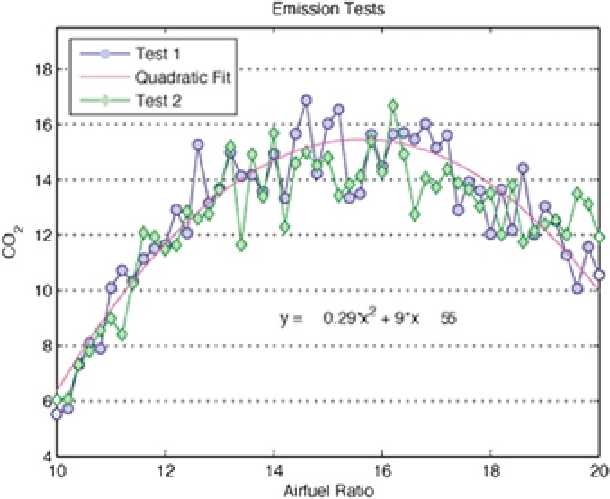
Figure
1-6
shows linear plots of the results of several tests of emissions of a motor, with a curve fitted to the data.
Figure 1-6.
MATLAB also provides functions for displaying two-dimensional arrays, three-dimensional scalar data and
three-dimensional vector data. It is possible to use these functions to visualize and understand large amounts of
multidimensional data that is usually complex. It is also possible to define the characteristics of the diagrams, such as
the orientation angle of the camera, perspective, lighting effects, the location of the source of light and transparency.
3D diagramming features include:
•
Surface, contour and mesh
•
Diagrams of images
•
Cone, pastel, flow and isosurface