Geoscience Reference
In-Depth Information
4.3.2
Presentation of uncertainty in Qualitative Uncertainty Scale
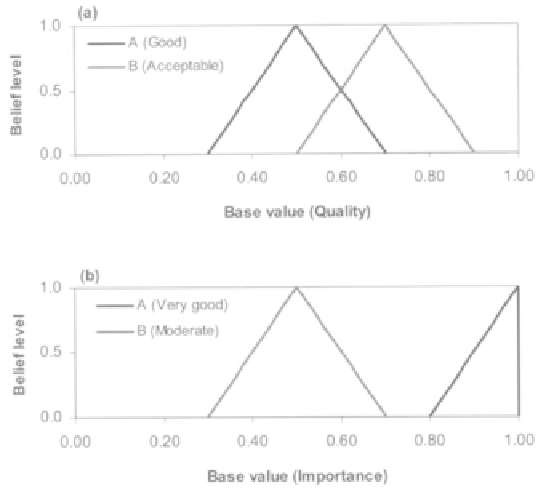
In order to illustrate how the computed uncertainty is measured on the QUS, a model of
two input uncertain (fuzzy) variables
A
and
B
are considered. Let the output of the model
is
C
(also fuzzy), such that
C
=
f (A, B)
. Qualitative assessments about the quality and
importance of the inputs
A
and
B
are arbitrarily represented by membership functions as
shown in Figure 4.10(a, b). The estimated uncertainty in
C
(the method is explained in
Subsection 3.2.2) is shown in Figure 4.11.
The estimated uncertainty is then presented in the QUS, which is derived according to
Subsection 4.3.1 (Fig. 4.12 (a, b)). Both fuzzy and crisp scales are shown. To present the
uncertainty on the crisp scales, the fuzzy representation of the estimated uncertainty in
C
is transformed to a crisp representation by the so-called defuzzification. Various methods
of defuzzification are available. Some commonly used methods are presented in
Appendix I. For the application in this example the
centre-of-area
method is used.
Figure 4.10.
Qualitative representation of uncertainty in two inputs
A
and
B:
(a)
Quality, (b) Importance.
Search WWH ::

Custom Search