Geoscience Reference
In-Depth Information
Expert-4
1.04
31.1
Average
1.51
--
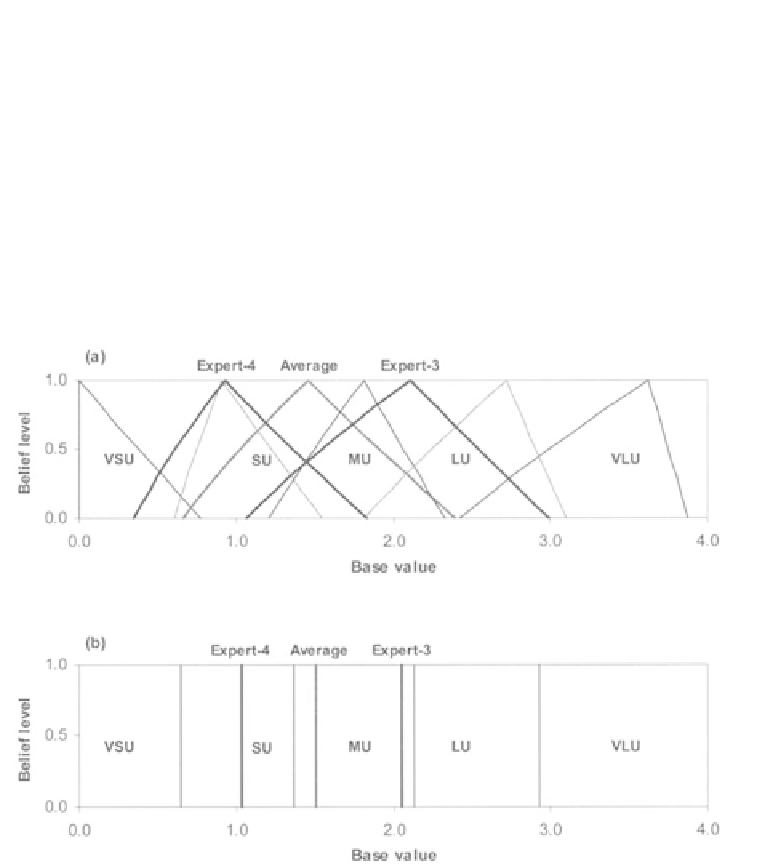
The results from Expert-1 and Expert-2 are very close to the average result, whereas, the
results of Expert-3 and Expert-4 show significant deviations from the average.
The Fuzzy Qualitative and Crisp Qualitative Scales based on the
best-case
and the
worst-case
are shown in Figure 6.15(a) and (b), respectively. The scale consists of five
divisions:
Very Small Uncertainty
(VSU),
Small Uncertainty
(SU),
Moderate Uncertainty
(MU),
Large Uncertainty
(LU) and
Very Large Uncertainty
(VLU) with the two
extremes VSU and VLU corresponding respectively to the
best-case
and the
worst-case
scenario results. The evaluated average uncertainty and the uncertainty evaluated based
on the assessments of Expert-3 and Expert-4 are presented on the scales.
Figure 6.15.
Estimated uncertainty based on the assessments by Expert-3,
Expert-4 and the average of the four experts represented on: (a) fuzzy
qualitative scales (b) crisp qualitative scale. The thin lines represent
the regions of uncertainty scales and the thick lines represent the
assessed uncertainty.
6.4.3
Conclusions
The qualitative method of uncertainty quantification presented here is relatively fast and
easy. Uncertainties due to all identified sources can be incorporated in a relatively short
time and with a small burden of computation. Moreover, experts' judgements over
Quality
and
Importance
can be updated with time by learning from experiences of the
past, and thereby improving the quality of the uncertainty estimation. An obvious
Search WWH ::

Custom Search