Geoscience Reference
In-Depth Information
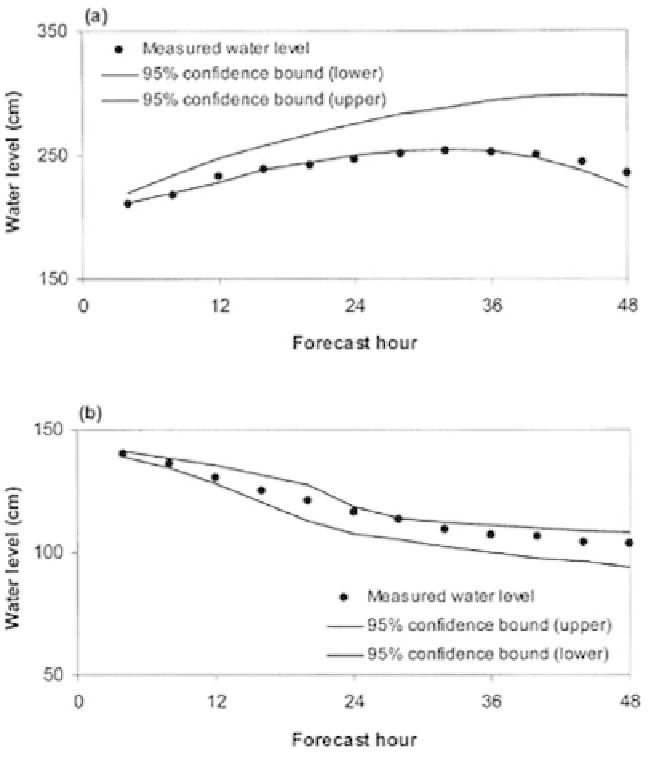
Figure 6.6.
Measured water levels and 95% confidence bounds to the forecasted
water levels: (a) during rising flow, and (b) during subsiding flow
situations.
The second part of the analysis is focused on finding an appropriate value of the
coefficient of variation for the rating curve conversions so as to keep the observed water
levels within the 95% confidence limits for the rising flow case. The uncertainty
contributions of the rating curve conversions to the uncertainty in the forecasts are com-
puted considering different levels of uncertainty in the rating curves with the CoV rang-
ing from 0.1 to 0.3. The results are shown in Figure 6.7. It can be observed that the in-
crease in the uncertainty contribution is more or less linear with the increase in the CoV.
95% confidence bounds are computed for the total uncertainty with different levels of
uncertainty in the rating curves. Figure 6.8 shows the observed water levels with the 95%
bounds for the CoV values of 0.1, 0.15 and 0.2 in the rating curve conversions. It is seen
that the observed water levels can be well within the 95% confidence bounds with the
CoV of 0.2.
Search WWH ::

Custom Search