Geoscience Reference
In-Depth Information
The total estimated uncertainty (standard deviations) together with the forecasted water levels
are shown in Figure 6.5 for the cases with rising and subsiding flows. The uncertainty is
clearly larger for the rising flow than for the subsiding flow. The figure also shows that
the estimated uncertainty by and large is increasing with increasing forecast lead-time.
The 95% confidence bounds for the forecasts at different lead-times are plotted with
the corresponding observed water levels, both for the rising and subsiding flow cases
Figure 6.4.
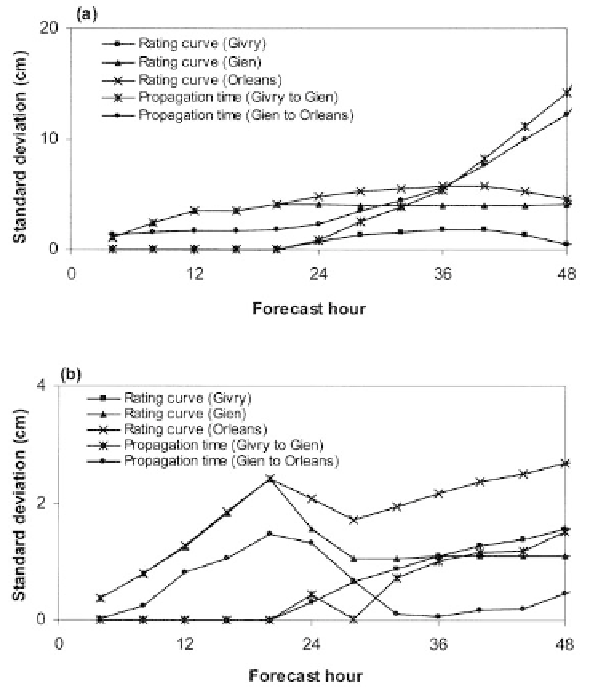
Uncertainty (standard deviation) in forecast water levels due to
various uncertain parameters: (a) during rising flow, and (b) during
subsiding flow situations.
Search WWH ::

Custom Search