Geoscience Reference
In-Depth Information
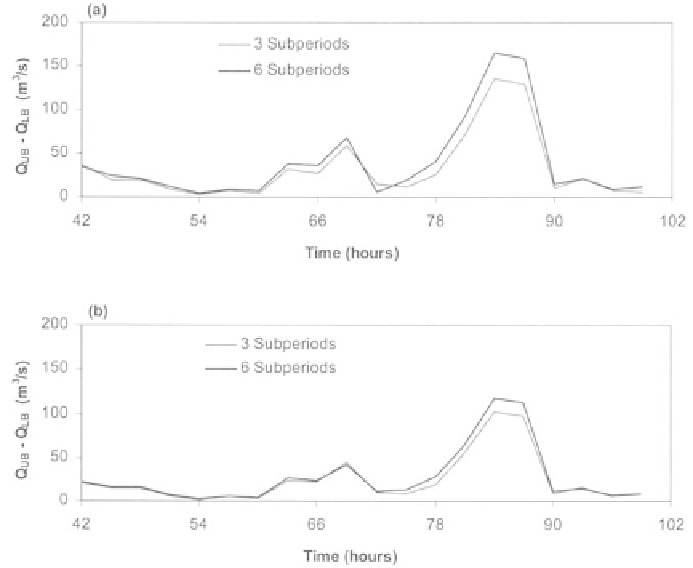
Figure 5.16 shows the comparison of uncertainty bounds of cases with 3 and 6
subperiods for
!
=0 and 1. It can be observed that the increase in the uncertainty bound is
not very significant compared to the increase in the number of subperiods. This allows
the limitation to a reasonably small number of subperiods without too much
underestimation of the uncertainty in the output.
Figure 5.16.
Uncertainty range in forecasted discharges (Q
UB
-Q
LB
) with
reconstructed precipitation for: (a)
!
-cut level 0, and (b)
!
-cut level 1.
5.4.3
Results by normal GA and micro GA: a comparison
In general the results produced by the normal GA and the micro GA are very close to
each other. The comparisons of the results given by the nGA and the mGA are shown in
Figures 5.17 and 5.18 for three cases: (a) 3 subperiods with varying temporal distribution
over subbasins, (b) 3 subperiods with same temporal distribution for all subbasins, and
(c) 6 subperiods with same temporal distribution for all subbasins. Figure 5.17 (a-c)
compares the difference Q
UB
-Q
LB
produced by the nGA, the mGA and the best of the
two GAs. Similarly, the difference in the lower bounds and in the upper bounds produced
by the nGA and mGA are presented in Figure 5.18. The complete membership functions
of the forecasted discharges given by the best of the two GAs are presented in
Figure 5.19 (a-c). These MFs correspond to the case with 3 subperiods and with
varying temporal distribution over subbasins.
Search WWH ::

Custom Search