Environmental Engineering Reference
In-Depth Information
6.2
Kinetic models for selected substrates.
Table 6.1
Kinetic parameters from BMP modelling
Parameter values
Food waste
Maize silage
Cattle slurry
Eq. 6.1 Eq. 6.2 Eq. 6.1 Eq. 6.2 Eq. 6.1 Eq. 6.2
max
(l CH
4
g
1
VS added)
Y
0.470
0.470
0.345
0.345
0.260
0.260
P
1
0.88
1
0.60
1
0.33
k
or
k
0.73
1.02
0.44
1.50
0.09
0.50
1
k
0
0.06
0
0.07
0
0.05
2
2
R
0.9874
0.9980
0.9703
0.9987
0.9911
0.9978
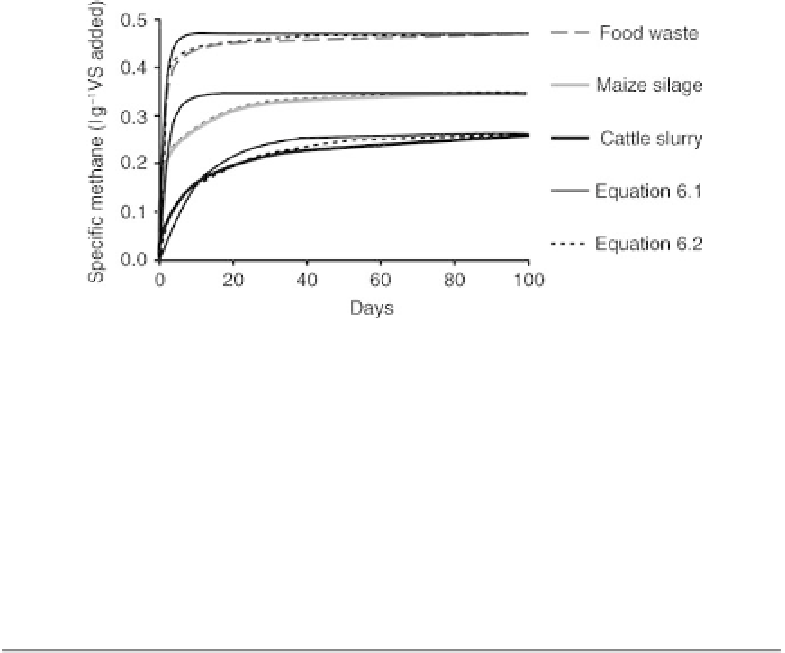
fractions. A better fit can be obtained by assuming that the gas production
curve reflects these different rates and properties. Methane production is
therefore given by
e
k
1
t
Þ
e
k
2
t
Y
¼
Y
max
1
P
ð
1
P
½
6
2
:
where Y is the cumulative methane yield at time t, Y
max
is the ultimate
methane yield, k
1
is the first-order rate constant for the proportion of readily
degradable material, k
2
is the first-order rate constant for the proportion of
less readily degradable material and P is the proportion of readily
degradable material. Results for food waste, maize silage and cattle slurry
are shown in Fig. 6.2 and the kinetic coefficients for equations 6.1 and 6.2
are given in Table 6.1. In each case it can be seen that equation 6.2 provides
a better fit. The P values of 0.88, 0.60 and 0.33 reflect the relative
proportions of readily degradable material in food waste, maize silage and
cattle slurry respectively. The decay constant k
2
is similar in all three cases,
but the k
1
values are different. As expected k
1
is higher for food waste than
for cattle slurry as the latter has effectively already undergone a digestion
process. Maize has the highest value of all, reflecting the presence of
fermentation products from the ensiling process that are almost immediately
available for uptake by the methanogenic population.


Search WWH ::

Custom Search