Image Processing Reference
In-Depth Information
Table 3.1
Overview of Chapter 3
Main topic
Sub topics
Main points
Image
Portray
variation
in image brightness
Histograms, image contrast.
description
content as a graph/
histogram.
Point
Calculate
new
image points as a
Histogram manipulation; intensity
operations
function
of the point at the same place in
mapping: addition, inversion, scaling,
the original image. The functions can
logarithm, exponent. Intensity
be
mathematical
, or can be computed
normalisation; histogram equalisation.
from the image itself and will change the
Thresholding and optimal thresholding.
image's histogram. Finally,
thresholding
turns an image from
grey
level to a
binary
(black and white) representation.
Group
Calculate new image points as a
Template convolution (including
operations
function of
neighbourhood
of the
frequency domain implementation):
point at the same place in the original
direct averaging, median filter, mode
image. The functions can be
statistical
filter.
including: mean (average); median
and mode.
400
p_
histogram
bright
200
0
100
200
Bright
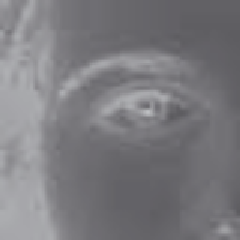
(a) Image of eye
(b) Histogram of eye image
Figure 3.1
An image and its histogram
image, if the ideal histogram is known. We might want to remove this noise, not only to
improve the appearance of the image, but to ease the task of (and to present the target better
for) later feature extraction techniques. This chapter concerns these basic operations which
can improve the appearance and quality of images.
The histogram can be evaluated by the operator
histogram
, in Code
3.1
. The operator
first initialises the histogram to zero. Then the operator works by counting up the number
of image points that have an intensity at a particular value. These counts for the different
values form the overall histogram. The counts are then returned as the two-dimensional
histogram (a vector of the count values) which can be plotted as a graph, Figure
3.1
(b).