Image Processing Reference
In-Depth Information
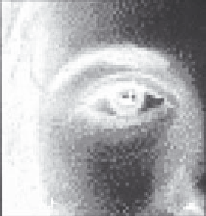
So we'll equalise our eye:
new_pic:=equalise(eye)
0123456789 0
26
0
1
2
3
4
5
6
7
8
9
10
11
12
35
43
78
78
64
64
47
26
45
59
47
43
54
78
57
64
64
26
26
47
59
54
64
64
73
73
78
35
35
35
54
59
54
59
64
78
78
64
26
13
35
54
61
54
64
64
73
70
51
35
26
47
54
73
new_pic =
64
64
64
78
68
43
26
52
47
61
78
65
64
59
70
51
26
45
64
64
64
64
64
57
78
73
43
26
54
54
64
64
51
51
61
86
57
26
38
54
65
64
57
35
35
64
78
43
26
26
52
68
57
54
47
45
73
70
43
26
26
59
68
57
36
47
52
68
51
43
43
13
47
54
57
54
51
52
61
43
35
26
26
35
35
45
45
47
(a)
(b)
This is how Mathcad displays images when you display them using the surface plot
facility (which is why we're using the picture facility instead, it's faster too!). Now try
equalising the image
brighter
(as defined earlier) - do you expect the result you get?
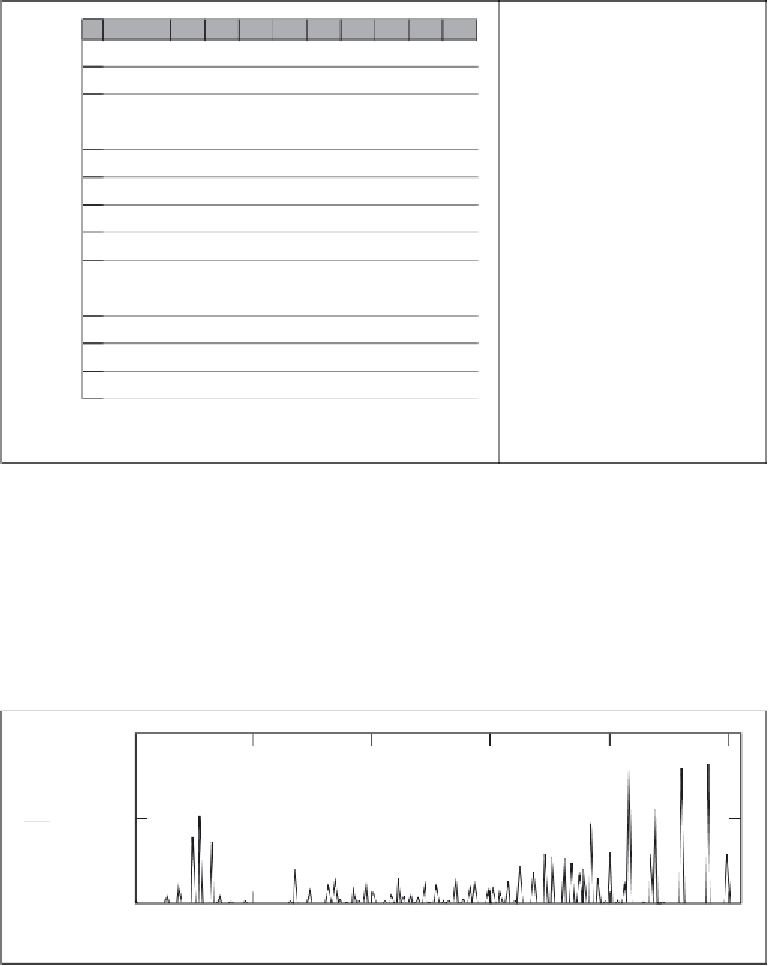
The histogram tells us what has really happened to the picture:
e_hist:=histogram
(new_pic)
400
e
n_hist
bright
200
0
0
50
100
150
200
250
Bright
One way of interpreting this is that the histogram is now
balanced
between black and
white.