Image Processing Reference
In-Depth Information
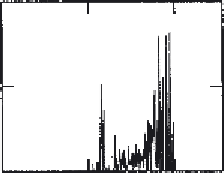
So let's work out the histogram of our eye image:
eye_histogram:=histogram(eye)
To display it, we need a horizontal axis which gives the range of brightness levels
bright:=0..255
400
eye
_histogram
bright
200
0
0
100
200
Bright
So here's the histogram of our picture of the eye image,
p
. The
bright
pixels relate mainly
to the
skin
, the
darker
ones to the
hair
.
The most common
point operator
replaces each pixel by a scaled version of the original
value. We therefore multiply each pixel by a number (like a
gain
), by specifying a function
scale which is fed the picture and the gain, or a
level
shift (upwards or downwards). The
function
scale
takes a picture
pic
and multiplies it by
gain
and adds a
level
scale(pic,gain,level):= for x
∈
0..cols(pic)-1
Address the whole picture
for y
∈
0..rows(pic)-1
newpic
y,x
←
floor
Multiply pixel
(gain·pic
y,x
+level)
by gain and add level
Output the picture
newpic
So let's apply it:
brighter:=scale(eye, 1.2, 10)
You can change the settings of the parameters to see their effect, that's why you've got
this electronic document. Try making it brighter and darker. What happens when the gain
is too big (>1.23)?
So our new picture looks like the one overleaf (using Mathcad's picture display facility):
The difference is clear in the magnitude of the pixels, those in the 'brighter' image are
much larger than those in the original image, as well as by comparison of the processed
with the original image. The difference between the images is much clearer when we look
at the histogram of the brighter image. So let's have a look at our scaled picture:
b_eye_hist:=histogram(brighter)


