Image Processing Reference
In-Depth Information
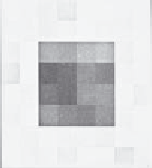
Consider, for example, the matrix of pixel values in Figure
1.13
(a). This can be viewed
as a surface (or function) in Figure
1.13
(b), or as an image in Figure
1.13
(c). In Figure
1.13
(c) the brightness of each point is proportional to the value of its pixel. This gives the
synthesised image of a bright square on a dark background. The square is bright where the
pixels have a value around 40 brightness levels; the background is dark, these pixels have
a value near 0 brightness levels. This image is first given a label,
pic
, and then
pic
is
allocated, :=, to the matrix defined by using the matrix dialog box in Mathcad, specifying
a matrix with 8 rows and 8 columns. The pixel values are then entered one by one until the
matrix is complete (alternatively, the matrix can be specified by using a subroutine, but that
comes later). Note that neither the background, nor the square, has a constant brightness.
This is because noise has been added to the image. If we want to evaluate the performance
of a computer vision technique on an image, but without the noise, we can simply remove
it (one of the advantages to using synthetic images). The matrix becomes an image when
it is viewed as a picture, as in Figure
1.13
(c). This is done either by presenting it as a
surface plot, rotated by zero degrees and viewed from above, or by using Mathcad's picture
facility. As a surface plot, Mathcad allows the user to select a greyscale image, and the
patch plot option allows an image to be presented as point values.
12 3
4 1 121
22 3
2 1 221
40
30
20
1
0
2
3
1 38
39
37 36
3
1
4
1 45
44
41 42
2
1
6
pic : =
1
2 43
44
40 39
1
3
2
1 39
41
42 40
2
1
4
6
12 1
2 2 311
12 1
3 1 142
pic
(a) Matrix
(b) Surface plot
(c) Image
Figure 1.13
Synthesised image of a square
Mathcad stores matrices in row-column format. The co-ordinate system used throughout
this text has
x
as the horizontal axis and
y
as the vertical axis (as conventional). Accordingly,
x
is the column count and
y
is the row count so a point (in Mathcad) at co-ordinates
x,y
is actually accessed as
pic
y,x
. The origin is at co-ordinates
x
= 0 and
y
= 0 so
pic
0,0
is
the magnitude of the point at the origin and
pic
2,2
is the point at the third row and third
column and
pic
3,2
is the point at the third column and fourth row, as shown in Code
1.1
(the points can be seen in Figure
1.13
(a)). Since the origin is at (0,0) the bottom right-hand
point, at the last column and row, has co-ordinates (7,7). The number of rows and the
number of columns in a matrix, the dimensions of an image, can be obtained by using the
Mathcad
rows
and
cols
functions, respectively, and again in Code
1.1
.
pic
2,2
=38 pic
3,2
=45
rows(pic)=8 cols(pic)=8
Code 1.1
Accessing an image in Mathcad