Image Processing Reference
In-Depth Information
E
E
xy
,
xy
,
xy
=
circle.perimeter
+
parabolae.perimeter
xy
,
circle.perimeter
,
parabolae.perimeter
E
e
(6.3)
and we seek a combination of values for the parameters {
c
p
,
a
,
b
,
c
,
c
c
,
r
}which maximise
this energy. This, however, implies little knowledge of the
structure
of the eye. Since we
know that the sclera is white (usually) and the iris is darker than it, then we could build this
information into the process. We can form an energy
E
v
for the circular region which
averages the brightness over the circle area as
E
v
= -
P
circle.area
(6.4)
xy
,
xy
,
circle
This is formed in the negative, since maximising its value gives the best set of parameters.
Similarly, we can form an energy functional for the light regions where the eye is white as
E
p
E
p
=
P
parabolae-circle.area
(6.5)
x y
,
xy
,
parabolae-circle
where parabolae-circle implies points within the parabolae but not within the circle. We
can then choose a set of parameters which maximise the combined energy functional
formed by adding each energy when weighted by some chosen factors as
E
=
c
e
·
E
e
+
c
v
·
E
v
+
c
p
·
E
p
(6.6)
where
c
e
,
c
v
and
c
p
are the weighting factors. In this way, we are choosing values for the
parameters which simultaneously maximise the chance that the edges of the circle and the
perimeter coincide with the image edges, that the inside of the circle is dark and that the
inside of the parabolae are light. The value chosen for each of the weighting factors
controls the influence of that factor on the eventual result.
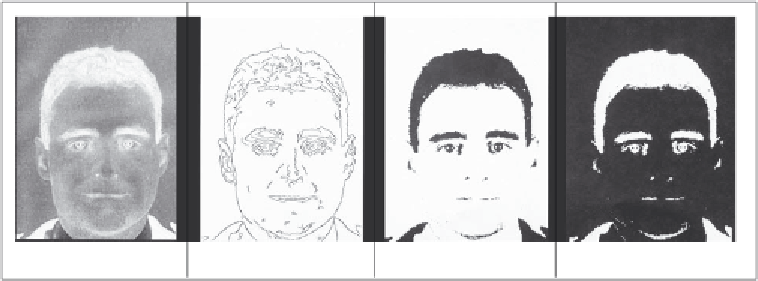
The energy fields are shown in Figure
6.2
when computed over the entire image. Naturally,
the valley image shows up regions with low image intensity and the peak image shows
regions of high image intensity, like the whites of the eyes. In its original formulation, this
approach actually had five energy terms and the extra two are associated with the points
P
e
1
and
P
e
2
either side of the iris in Figure
6.1
(a).
(a) Original image
(b) Edge image
(c) Valley image
(d) Peak image
Figure 6.2
Energy fields over whole face image