Image Processing Reference
In-Depth Information
gather evidence only when the gradient direction is the
same
. Notice that the square root
in the definition of the magnitude in Equation 5.83 can have positive and negative values.
The sign must be selected in a way that the vector has the correct direction.
5.5.3
The GHT technique
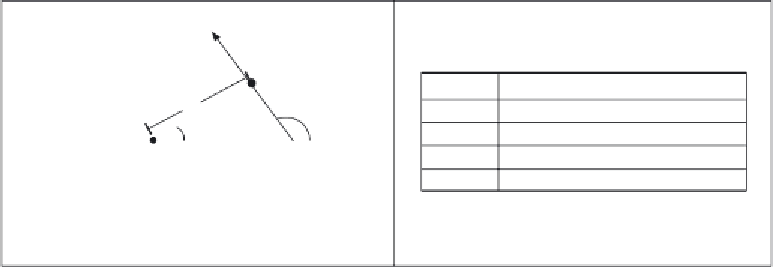
Equations 5.74 and 5.81 define an HT mapping function for arbitrary shapes. The geometry
of these equations is shown in Figure
5.21.
Given an image point ω
i
we have to find a
displacement vector γ (λ , ρ ). When the vector is placed at ω
i
, then its end is at the point
b
.
In the GHT jargon, this point is called the reference point. The vector γ (λ , ρ ) can be easily
obtained as λ
R
(ρ ) υ (θ ) or alternatively as
re
α
. However, in order to evaluate these equations,
we need to know the point υ (θ ). This is the crucial step in the evidence gathering process.
Notice the remarkable similarity between Figures
5.17
(a),
5.19
(a) and Figure
5.21
(a). This
is not a coincidence, but Equation 5.60 is a particular case of Equation 5.73.
Edge vector
ω
i
ˆ
= (r,
α
)
i
r
α
(
λ
,
ρ
)
0
(r
0
,
0
), (r
1
,
1
), (r
2
,
2
)
φ
i
M
b
2
M
Reference point
…
…
Target shape
(a) Displacement vector
(b) R-table
Figure 5.21
Geometry of the GHT
The process of determining υ
(θ
) centres on solving Equation 5.76. According to this
equation, since we know
ˆ
i
,
then we need to find the point υ
(θ
) whose gradient direction
is
ˆ
i
+ = 0.
Then we must use υ (θ ) to obtain the displacement vector γ (λ , ρ ). The GHT
pre-computes the solution of this problem and stores it an array called the
R-table
. The R-
table stores for each value of
ˆ
φ
i
the vector γ (λ , ρ ) for ρ = 0 and λ = 1. In polar form, the
vectors are stored as a magnitude direction pair and in Cartesian form as a co-ordinate pair.
The possible range for
ˆ
φ
i
is between - π /2 and π /2 radians. This range is split into
N
equispaced slots, or bins. These slots become rows of data in the R-table. The edge direction
at each border point determines the appropriate row in the R-table. The length,
r
, and
direction, α , from the reference point is entered into a new column element, at that row, for
each border point in the shape. In this manner, the
N
rows of the R-table have elements
related to the border information, elements for which there is no information contain null
vectors. The length of each row is given by the number of edge points that have the edge
direction corresponding to that row; the total number of elements in the R-table equals the
number of edge points above a chosen threshold. The
structure
of the R-table for
N
edge
direction bins and
m
template border points is illustrated in Figure
5.21
(b).
The process of
building
the R-table is illustrated in Code
5.10
. In this code, we implement