Image Processing Reference
In-Depth Information
simultaneously. This kind of problem can be solved, for example, using linear least squares
techniques. The HT uses an
evidence gathering
approach to provide the solution.
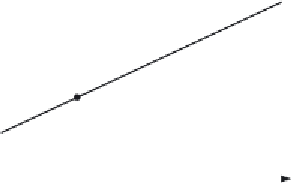
The relationship between a point (
x
i
,
y
i
) in an image and the line given in Equation 5.27
is illustrated in Figure
5.6
. The points (
x
i
,
y
i
) and (
x
j
,
y
j
) in Figure
5.5
(a) define the lines
U
i
and
U
j
in Figure
5.6
(b), respectively. All the collinear elements in an image will define dual
lines with the same concurrent point (
A
,
B
). This is independent of the line parameterisation
used. The HT solves it in an efficient way by simply counting the potential solutions in an
accumulator array that stores the evidence, or votes. The count is made by tracing all the
dual lines for each point (
x
i
,
y
i
). Each point in the trace increments an element in the array,
thus the problem of line extraction is transformed in the problem of locating a maximum
in the accumulator space. This strategy is robust and has demonstrated to be able to handle
noise and occlusion.
y
A
U
i
U
j
(x
j
, y
j
)
(A, B)
(x
i
, y
i
)
x
B
(a) Image containing a line
(b) Lines in the dual space
Figure 5.6
Illustrating the Hough transform for lines
The axes in the dual space represent the parameters of the line. In the case of the
Cartesian parameterisation
m
can actually take an
infinite
range of values, since lines can
vary from horizontal to vertical. Since votes are gathered in a discrete array, then this will
produce
bias
errors. It is possible to consider a range of votes in the accumulator space that
cover all possible values. This corresponds to techniques of antialiasing and can improve
the gathering strategy (Brown, 1983), (Kiryati, 1991).
The implementation of the HT for lines,
HTLine
, is given in Code
5.3
. It is important
to observe that Equation 5.27 is not suitable for implementation since the parameters can
take an infinite range of values. In order to handle the infinite range for
c
, we use two
arrays in the implementation in Code
5.3.
When the slope
m
is between - 45° and 45º, then
c
does not take a large value. For other values of
m
the intercept
c
can take a very large
value. Thus, we consider an accumulator for each case. In the second case, we use an array
that stores the intercept with the
x
axis. This only solves the problem partially since we
cannot guarantee that the value of
c
will be small when the slope
m
is between - 45°
and
45° .
Figure
5.7
shows three examples of locating lines using the HT implemented in Code
5.3
. In Figure
5.7
(a) there is a single line which generates the peak seen in Figure
5.7
(b).