Information Technology Reference
In-Depth Information
Fig. 2.
Entropy difference, cluster density 0
.
80
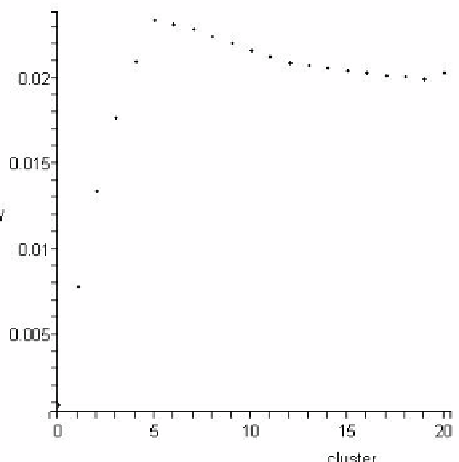
Fig. 3.
Entropy difference
A more general test:
For our final experiment, we used a network of 10
,
000
nodes with a background density of 0
.
05. We then added clusters, with densities
all at 0
.
80, whose node counts summed to 5
,
000, or half the total network. To
this mix we then add one cluster of 1000 nodes, or 10% of the entire network.
The sequences of clusters added were of the percentages of the total network
indicated in Table 1. For example, the first experiment used a single cluster that