Geology Reference
In-Depth Information
100
90
80
70
60
50
0.1-in. penetration
39.5
1000
40
CBR = X 100 = 4.0%
0.2-in. penetration
30
56.7
1500
CBR = X 100 = 3.8%
20
Design CBR = 4.0%
10
0
0.1
0.2
0.3
0.4
0.5
Penetration (in.)
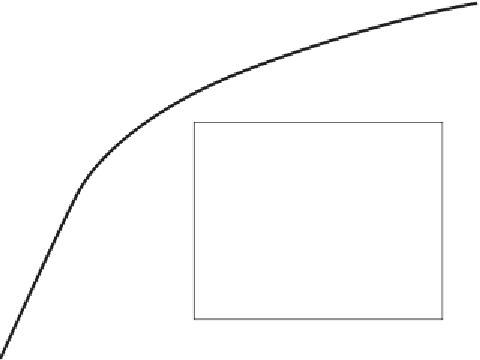
Figure 24-6
Curve of Penetration Stress versus Penetration
These values fill in the second row of the form on page 408. Similar
calculations furnish required values for succeeding piston loads and
penetration stresses for completing the remaining rows on the form.
The curve of penetration stress versus penetration is plotted and
shown in Figure 24-6. Since the curve is not concave upward initially,
no zero point correction is required.
The bearing ratio at 0.10-in. penetration is determined by dividing
the penetration stress for 0.10-in. penetration (from the curve of pene-
tration stress versus penetration) by the standard penetration stress of
1,000 psi and multiplying by 100:
CBR at 0.10
-
in. penetration
39.5
1,000
100
4.0
%
The bearing ratio at 0.20-in. penetration is determined similarly using
the penetration stress for the 0.20-in. penetration and a standard pen-
etration stress of 1,500 psi:
CBR at 0.20
-
in. penetration
56.7
1,500
100
3.8
%
Inasmuch as the bearing ratio at 0.10-in. penetration is greater than
that at 0.20-in. penetration, the ratio at 0.10-in. penetration should be
reported as the design CBR.
Hence, in this example, the CBR is 4.0%.


Search WWH ::

Custom Search