Geology Reference
In-Depth Information
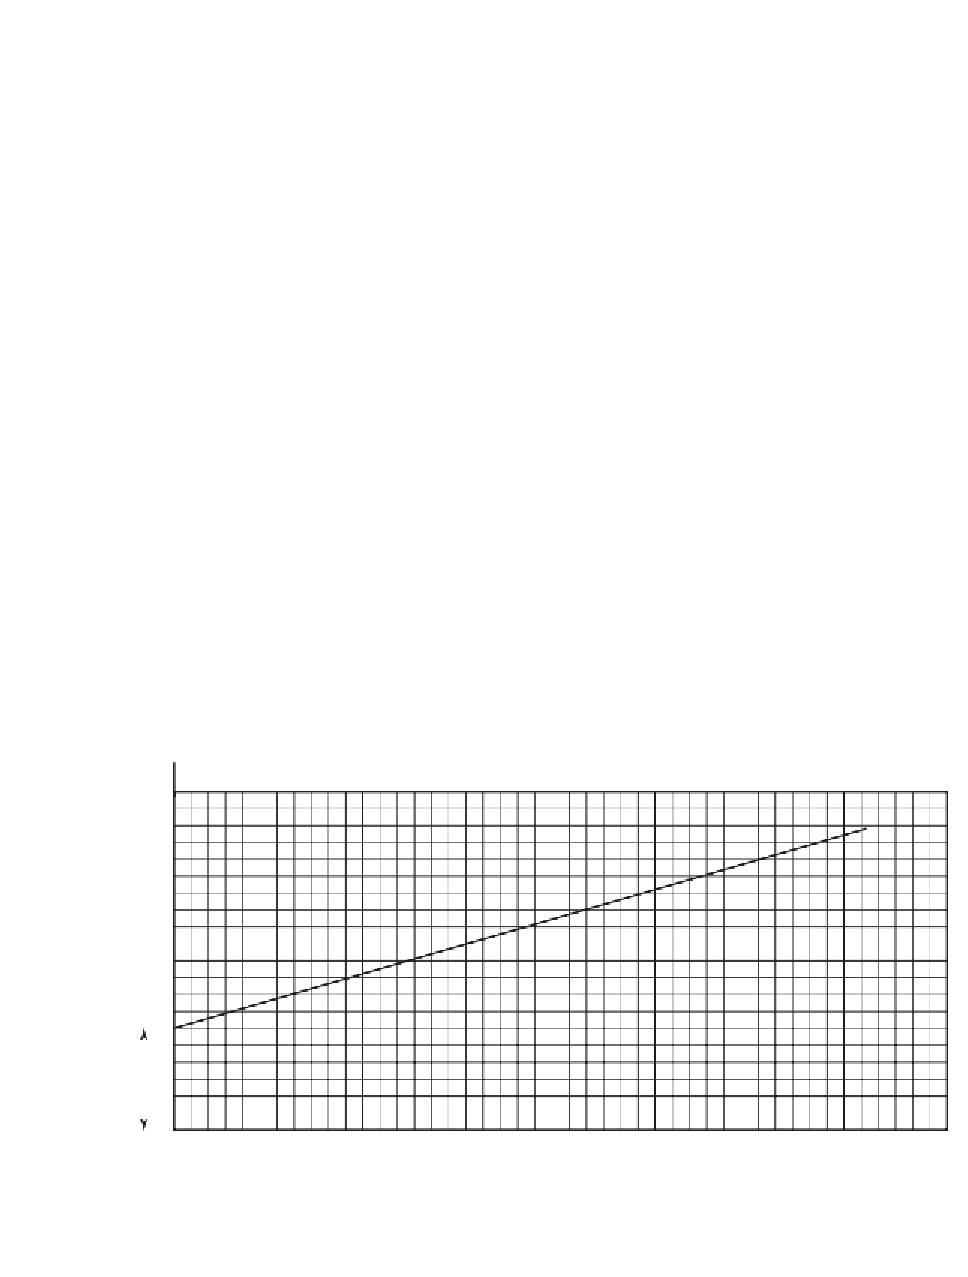
It will be noted that two additional stress-strain curves for other
triaxial compression tests on different specimens, along with associated
values of
σ
1
, are presented in Figure 22-6. Neither the test
data nor required subsequent calculations for defining these curves are
given in this example. They are provided at this point in order to com-
plete the evaluation of the shear strength parameters.
p
, and
σ
3
, Δ
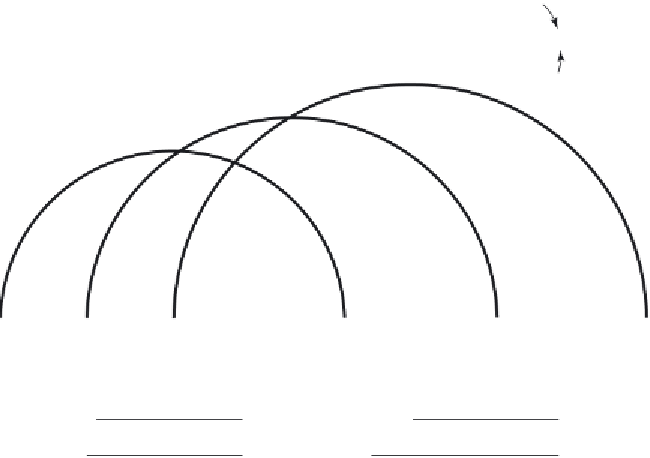
[D] Shear Diagram (Mohr Circles for Triaxial Compression)
From results of the triaxial test for which data are given in this example,
a point is located along the abscissa at a distance
or 10.0 psi, from the
origin (see Figure 22-7). Another point is located along the abscissa at a
distance
σ
3
,
σ
1
, or 50.0 psi, from the origin. With the straight line connecting
these points as a diameter, a semicircle is then constructed as shown in
Figure 22-7. By repeating the process for the test for the second specimen
(
20.0 psi,
67.6 psi), points are located along the abscissa at
σ
3
σ
1
σ
3
20.0 psi and
67.6 psi from the origin, and a semicircle is drawn.
Another semicircle is then constructed in the same manner for the test
for the third specimen (
σ
1
85.5 psi).
With the three semicircles thus constructed, a straight line tan-
gent to the semicircles is drawn as shown in Figure 22-7. The angle
between this straight line and a horizontal line is measured as 16°,
and the value of shear stress where the straight line intersects the
ordinate is observed to be 12.3 psi. Hence, the angle of internal friction
and the cohesion for this soil are 16° and 12.3 psi, respectively. These
values (the shear strength parameters) are the major results of a
triaxial compression test.
30.0 psi,
σ
3
σ
1
40
30
ø = 16˚
20
10
0
10
20
30
40
50
60
70
80
90
Normal stress,
σ
(psi)
1 2
J D
S R 1 0 1 1
6 / 8 / 08
Sample No.
Project No.
Plotted by
Date
Figure 22-7
Mohr Circles for Triaxial Compression


Search WWH ::

Custom Search