Geology Reference
In-Depth Information
8.0
7.0
6.0
5.0
4.0
3.0
2.0
100
1,000
10,000
100,000
Pressure, p (lb/ft
2
)
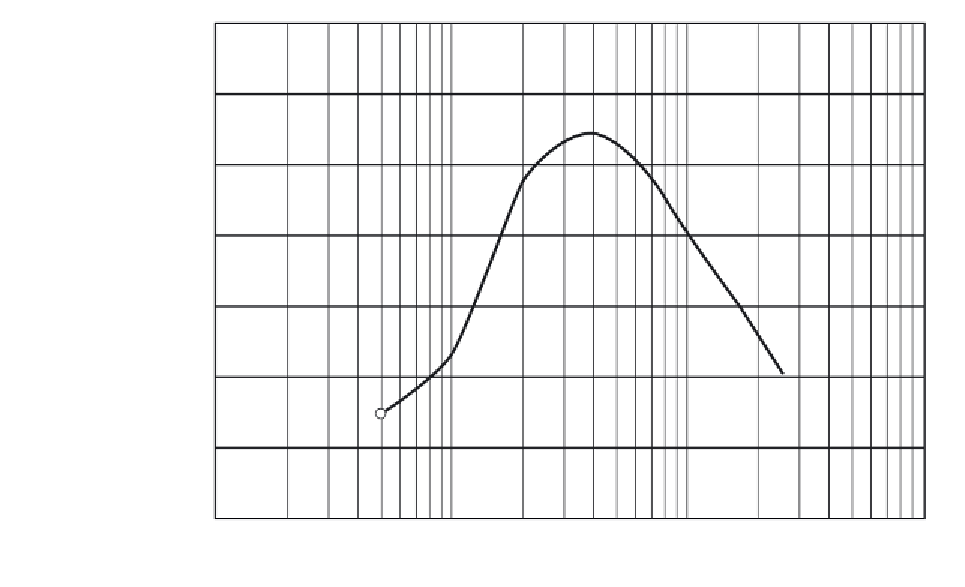
Figure 20-6
Coefficient of Consolidation versus Logarithm of Pressure
the primary results of a consolidation test. The
c
v
- log
p
curve for this
example is shown in Figure 20-6.
SUMMARY
The compressibility of soils is one of the most useful properties that
can be obtained from laboratory testing. The primary results of a lab-
oratory consolidation test are (1)
e
- log
p
curve, (2)
c
v
- log
p
curve,
and (3) initial void ratio of the soil
in situ
. Using these data, soils
engineers can estimate both the rate and magnitude of the consolida-
tion settlement of structures. Estimates of this type are often critical
in selecting a type of foundation and then evaluating its adequacy. (For
detailed information on such computations, see Liu and Evett, 2008 [3].)
In addition to containing the preceding three primary results of a
laboratory consolidation test, the written report would normally include
the various time curves (i.e., plots of the logarithm of time versus defor-
mation), values of other parameters determined in the course of the test
(e.g., initial and final moisture content, dry mass and initial and final
wet unit weight, initial degree of saturation, specific gravity of solids,
and Atterberg limits if obtained), and any other pertinent information,
such as specimen dimensions and an identification and description of
the test sample, including whether the soil is undisturbed, remolded,
compacted, or otherwise prepared.
As should be rather obvious, the consolidation test is among the
most comprehensive and time-consuming soil tests. It is also among the
most expensive tests when performed by a commercial laboratory.


Search WWH ::

Custom Search