Geology Reference
In-Depth Information
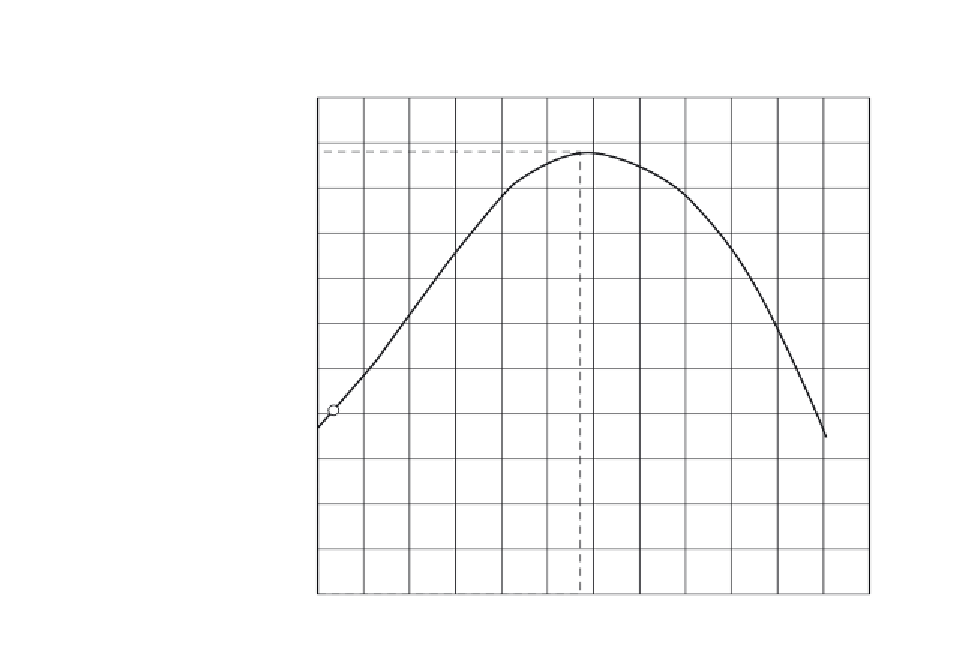
Figure 12-6
Compaction Curve
Optimum moisture content = 20.7%
Maximum dry unit weight = 104.8 lb/ft
3
Max. dry unit weight = 104.8 lb/ft
3
105
104
103
102
101
100
99
98
97
96
95
15
16
17
18
19
20
21
22
23
24
25
26
27
Moisture content (%)
The primary values determined in a compaction test are, of course, the
optimum moisture content and maximum dry unit weight; however,
the written report would normally also include the compaction curve and
the data form. In addition, the origin of the material tested, as well as a
description of it, would normally be included, together with an indication
of the method used (A, B, or C) and the preparation (moist or dry).
Type of soil is the primary factor affecting maximum dry unit
weight and optimum moisture content for a given compactive effort and
compaction method. Maximum dry unit weights may range from around
60 lb/ft
3
for organic soils to about 145 lb/ft
3
for well-graded, granular ma-
terial containing just enough fines to fill small voids. Optimum moisture
contents may range from around 5% for granular material to about 35%
for elastic silts and clays. Higher optimum moisture contents are gen-
erally associated with lower dry unit weights. Higher dry unit weights
are associated with well-graded granular materials. Uniformly graded
sand, clays of high plasticity, and organic silts and clays typically re-
spond poorly to compaction [4].
Tables 12-3 and 12-4 give some general compaction characteristics
of various types of soil. Table 12-3 gives ranges for both maximum dry
unit weight and optimum moisture content, along with anticipated
embankment performance for soils classified according to the AASHTO
system. Table 12-4 gives ranges for maximum dry unit weight together
with values as embankment, subgrade, and base material for soils clas-
sified according to the Unified Soil Classification System.
SUMMARY


Search WWH ::

Custom Search