Geology Reference
In-Depth Information
grain-size curve is necessary at this point. In Table 11-3, the two
equations used to examine the grain-size curve are
D
60
D
10
C
u
(11-2)
and
D
30
2
1
2
C
c
(11-3)
D
10
D
60
where
D
n
represents the diameter of soil particles at which
n%
of the
soil sample passes this diameter. In other words,
D
indicates parti-
cle size, and the subscript indicates percentage of soil sample that
is smaller than that particular particle size. As indicated in Table
11-3,
C
u
must be greater than or equal to 4, and
C
c
must be between
1 and 3 in order for the sample to be classified as “GW.” Otherwise,
the sample would be classified “GP.” Values of
D
60
,
D
30
, and
D
10
can
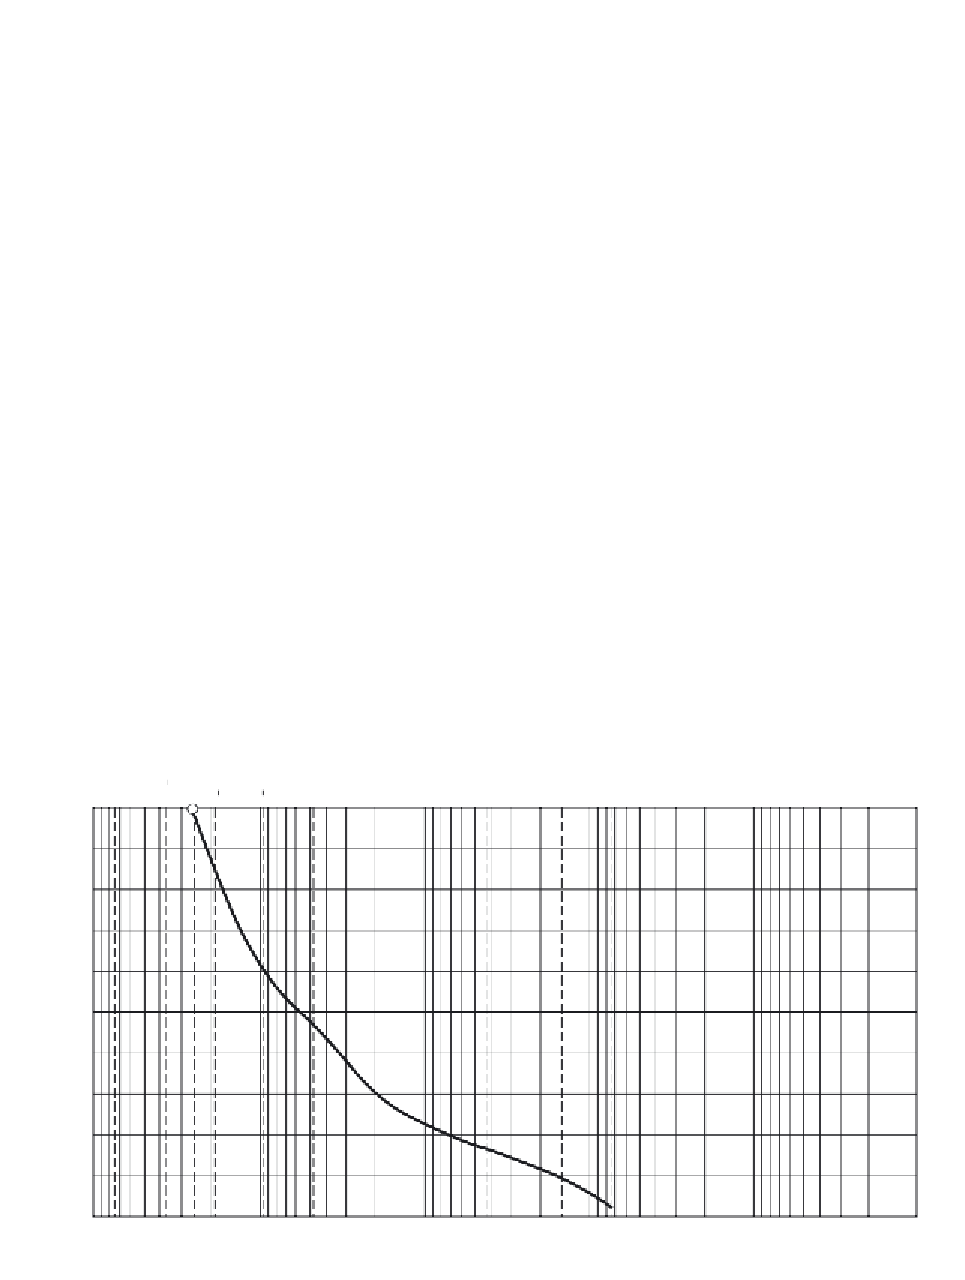
be obtained from the grain-size distribution curve (see Figure
11-7). (In this particular example, the values of
D
60
,
D
30
, and
D
10
are available coincidentally from the information given.)
D
60
corre-
sponds to a
3
⁄
8
-in. (9.5-mm) sieve,
D
30
corresponds to a No. 10 sieve
100
90
80
70
60
50
40
30
20
10
0
100.0
50.0
10.0
5.0
1.0
0.5
0.1
0.05
0.01
0.005
0.001
Grain diameter (mm)
Figure 11-7
Grain-Size Distribution Curve


Search WWH ::

Custom Search