Geoscience Reference
In-Depth Information
Table 6.3
Loss of cubic capacity in Hooghly river between Nabadweep and Cossipore
Cubic
capacity
m
3
Average loss
per year
m
3
Reach and
length
Tot a l loss
m
3
Loss per year
m
3
Percentage
loss per year
10
6
10
6
10
6
10
6
Year
×
×
×
×
1
2
3
4
5
6
7
Nabadwip
to Kalna
(34 km)
1937
1951
1963
26.60
23.39
21.29
3.21
2.10
0.23
0.17
0.20
0.75
Kalna to
Bansberia
(56 km)
1924
1951
1963
68.20
50.62
39.67
17.58
10.95
0.65
0.91
0.78
1.14
Bansberia to
Cossipore
(50 km)
1944
1951
1963
170.69
155.03
125.06
15.66
29.97
2.23
2.50
2.37
1.39
markets and other urban growth, the loss in the cubic capacity meant aggradation of
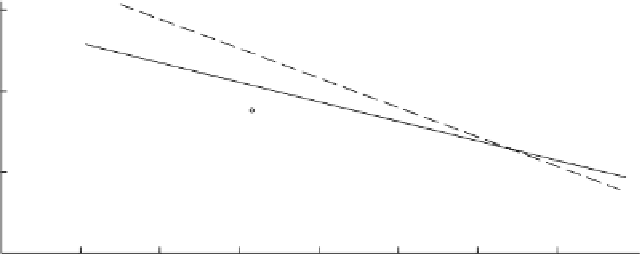
the bed. A physical assessment indicated a loss of 0.3% per year in this reach. The
decrease in the capacity is shown in Fig. 6.4.
Another physical assessment of the cubic capacity of the reach between
Panchpara and Uluberia (below
Rabindra Setu
) showed reduction at 3.05 m below
Khidirpur old dock sill (K.O.D.S.), as seen in Fig. 6.5.
It was difficult to assess loss or gain in cubic capacity, as no definite bank-line sur-
vey data were collected. The bank-line below Uluberia was unprotected and owing
to industries, particularly brick-kilns on both banks, lines had shifted. The assess-
ment below it showed both decrease and increase in the cubic capacity in certain
river reaches. The hydraulic mean depth also varied in the river-bed as well as over
the bars and crossings.
The basic problems of navigation in the Hooghly and especially over the bars
and crossings increased manifold. The navigable depth gradually reduced, leading
Fig. 6.4
Capacity reduction in Hooghly from Cossipore to hospital point


Search WWH ::

Custom Search