Geoscience Reference
In-Depth Information
iii. The maximum flow was 539,830 Mm
3
in 1978 (between 1975 and 1995) and
the minimum flow was 248,240 Mm
3
in 1992 (between 1995 and 1997); both
are shown in Table 4.6.
iv. The flow at Farakka reduced substantially in the lean season, as against that in
monsoon months, from July to December, the average ratio between the two
seasons between 1975 and 1995 being 1:9.74.
v. The minimum lean-season flow of 28,670 Mm
3
occurred in 1993 and the
maximum such flow of 61,370 Mm
3
occurred in 1984.
vi. The average lean-season flow was about 10% of the total annual flow and the
distribution of this flow between the downstream Ganga and River Bhagirathi
was 6 and 4%, respectively.
vii. The flow in the driest months, March to May, substantially reduced with a
minimum of 10,590 Mm
3
in 1975 and the maximum of 20,140 Mm
3
in 1979.
viii. Between 1976 and 1988, the total flow in the driest season, as shared between
the downstream river and the canal was in the ratio of about 60:40 and between
1989 and 1995, the share was in the ratio of 46:54.
ix. The average flow in the driest months from March to May was about 38% of
the average lean-season flow from January to June, and about 1.5% of the total
annual flow.
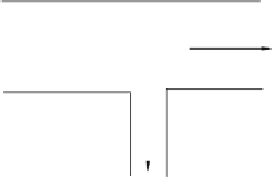
The flow distribution in the Ganga downstream and the Feeder Canal has been
shown in schematic line-diagrams in Figs. 8.3 and 8.4.
GANGA U/S
FLOW 100%
D/S
92%
a) Annual Flow
D/S
6%
GANGA U/S
FLOW 10%
GANGA U/S
FLOW 90%
D/S
86%
c) July to December
(Flood Season Flow)
b) January to June
(Lean Season Flow)
Fig. 8.3
Schematic line diagram showing the annual percentage flow distribution in Ganga and
Feeder canal


Search WWH ::

Custom Search