Agriculture Reference
In-Depth Information
3.0
2.5
2.0
1.5
1.0
7%
bre
3.8%
bre
0.5
0.0
-5
-4
-3
-2
-1
1
2
3
4
5
Days
Figure 10.5. Intestinal activity, expressed as constipation index, of sows fed isocaloric diets differing in crude
fibre content. Lower values indicate greater constipation state. Normal intestinal activity is considered above
the dashed line (Oliviero
et al
., 2009).
3.8%
bre
7%
bre
40
30
20
10
0
No constipation
Mild (2 days)
Severe (3-4 days)
Extremely
severe (≥ 5 days)
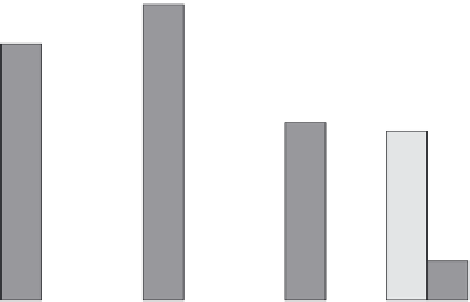
Figure 10.6. Incidence of different levels of constipation during the period from five days before to five days
after farrowing in sows fed a 7% FIBRE (n=40) or a 3.8% FIBRE (n=41) diet. Each category consists of various
numbers of consecutive days with absence of faeces (Oliviero
et al
., 2009).


