Image Processing Reference
In-Depth Information
TABLE .
Computed Frame Times and
Experimentally Measured Delays on Wireless Networks
Network Type
.a
.g
.b
Frame time (UDP), computed
.
.
.
Median delay (UDP), measured
.
.
.
Frame time (OPC), computed
.
.
.
Median delay (OPC), measured
.
.
.
Note:
All times in ms.
1
0.9
0.8
0.7
0.6
0.5
0.4
1
0.9
0.8
0.7
0.6
0.5
0.4
0.2
0.1
0.2
0.1
0
0.4
0.8
1.2
Delay (ms)
1.6
2
2.4
2.8
0
0.4
0.8
1.2
1.6
2
2.4
2.8
(a)
(b)
Delay (ms)
1
0.9
0.8
0.7
0.6
0.5
0.4
1
0.9
0.8
0.7
0.6
0.5
0.4
0.2
0.1
0.2
0.1
0
1.5
2
2.5
Delay (ms)
3
3.5
4
4.5
5
0
1.5
2
2.5
Delay (ms)
3
3.5
4
4.5
5
(c)
(d)
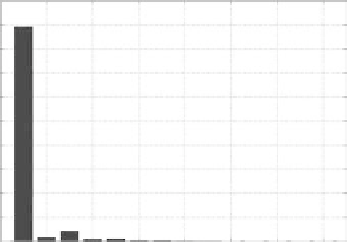
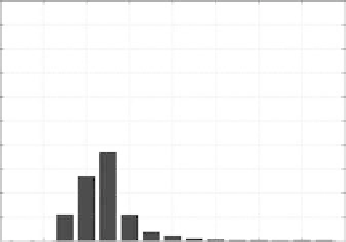
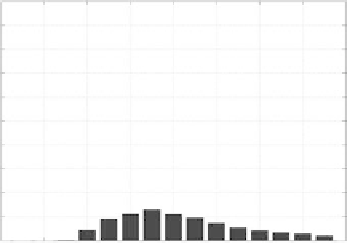
FIGURE .
Distributions of packet delays for different values of cross-traffic throughput on an .a network.
(a) UDP delays, Mb/s cross-traffic, (b) UDP delays, Mb/s cross-traffic, (c) OPC delays, Mb/s cross-traffic, and (d)
OPC delays, Mb/s cross-traffic.
the server at time
t
c
and arrived at the client at time
t
d
.hesumofthepre-andpostprocessingtimes
and the transmission time on the network for both messages can be computed as (assuming that the
two nodes are identical)
∗
T
delay
=
∗(
T
pre
+
T
Twait
+
T
tx
+
T
post
)=
t
d
−
t
a
−(
t
c
−
t
b
)
Note that this measurement does not require that the clocks on the client and server be synchronized.
As the delays at the two nodes can be different, it is this sum of the two delays that is plotted in
Figure . and tabulated in Table ..
Two diferent types of data packets were considered: user datagram protocol (UDP) and OPC. UDP
packets carry only a data load of bytes. OPC requires extra overhead to support an application
layer; consequently, the OPC packets contain data bytes (in addition to the overhead). For com-
parison purposes, the frame times (including the overheads) are computed for the different packets.