Image Processing Reference
In-Depth Information
T
post
T
post
T
post
Master
Slave 1
Slave 2
Slave 9
T
pre
T
pre
T
pre
T
wait
T
wait
T
wait
T
tx
T
tx
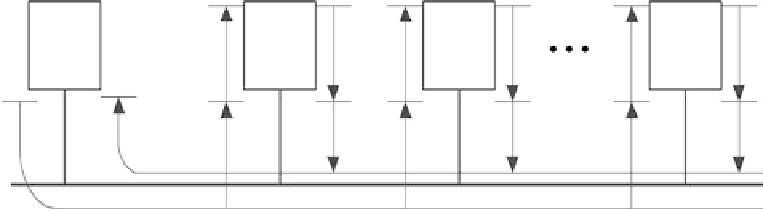
FIGURE .
Waiting time diagram for a strobe message configuration.
1000
800
600
*
400
200
0
0
2
4 6
Node number
8
10
FIGURE .
Nine identical devices with strobed message connection.
Figure . shows experimental data of the waiting time of nine identical devices with a strobed
message connection on a DeviceNet network; pairs of messages (request and response) were
collected. Each symbol denotes the mean, and the distance between the upper and lower bars equals
twostandarddeviations.Ifthesebarsareoverthelimit(maximumorminimum),thenthevalueof
the limit is used instead. It can be seen in Figure . that the average waiting time is proportional
to the node number (i.e., priority). Although all these devices have a very low variance of processing
time, the devices with the lowest node numbers have a larger variance of waiting time than the others,
because the variance of processing time occasionally allows a lower priority device to access the idle
network before a higher priority one.
23.2.3 Wired and Wireless QoS Metrics
The advent of wireless has added a new dimension to the QoS metric set that focuses heavily on the
QoS of the communication medium with respect to external factors. With wired networks, reliability
of data transmission is an important factor to consider. For example, some networks are physically
more vulnerable than others to data corruption by electromagnetic interference. his issue is much
more prevalent in wireless networks as there is a much higher potential exposure to external factors
that can reduce the quality of the communication medium. Both wired and wireless networks use
handshaking by sending of acknowledgment (ACK) messages to increase the reliability. If no ACK