Information Technology Reference
In-Depth Information
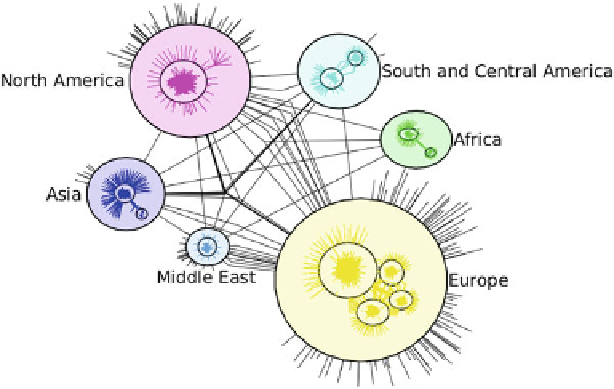
Fig. 6.6
Multiscale compound visualization of 2000 international air traffic network clustered
according to continents and then to subnetwork density
node “7”. The ability of this method to display both abstracted inter-cluster and
intra-cluster relationships has been shown in numerous work (
Auber et al.
,
2003
;
Balzer & Deussen
,
2007
;
Eades & Feng
,
1996
;
Huang & Eades
,
1999
).
6.3.4
Example Based the 2000 International
Air Traffic Network
In this section, we present some results that we obtained by analyzing the interna-
tional 2000 air traffic network.
Figure
6.6
shows a multiscale compound visualization of the 2000 international
air traffic network. In this representation, the first partition has been computed
according to geographical regions and then each cluster has been refined using a
clustering algorithm. That view of the network allows one to visualize intra-region
relationships while having an overview of inter-region ones.
However, the representation in Fig.
6.6
does not allow one to identify the
central airports (or hubs) of the network. This is mainly due to the utilization of
geographical positioning of the airports in the clustering process. Figure
6.7
shows
another representation of the same network. Connections with fewer than 300,000
passengers have been filtered out to remove “noise” from the data. Indeed, connec-
tions having few passengers may lead to inconsistent clusters (usually, clustering
algorithms are based on cluster density). When not using the geographical position-
ing of airports, one can see in Fig.
6.7
that clusters do not necessary correspond to
geographical regions of the network. For instance, the main international (e.g., Paris,
Search WWH ::

Custom Search