Information Technology Reference
In-Depth Information
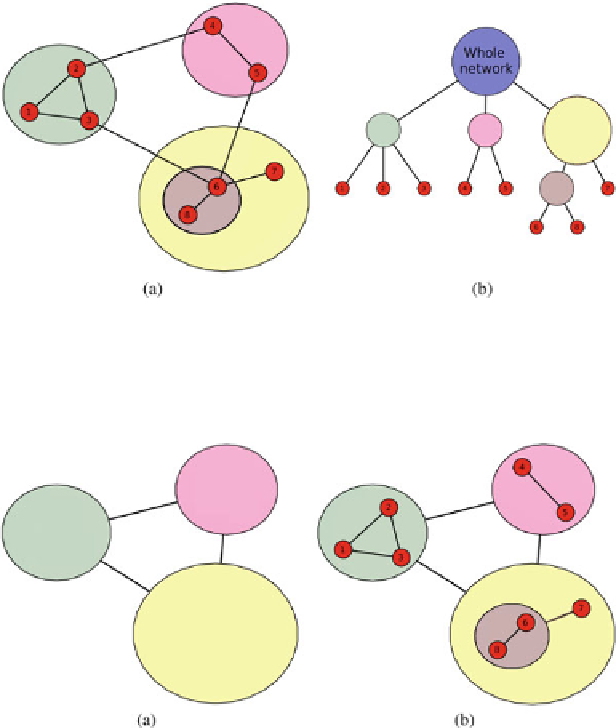
Fig. 6.4
(
a
) Example of a network that has been iteratively decomposed into clusters and
sub-clusters. Each of these clusters is shown in a particular color. (
b
) The corresponding data
representation where each leaf of the tree represents a node of the network, and an internal node
represents a cluster (Color figure online)
Fig. 6.5
(
a
) Classical compound visualization of the highest level of abstraction of the network
shown in Fig.
6.4
a; (
b
) corresponding multiscale visualization
reduces the visual clutter and increases the rendering speed. This abstraction is
usually called a compound graph, which is associated with the original graph and the
partition (see Fig.
6.5
). If repeated iteratively, this process allows the construction
of abstractions of higher and higher levels.
6.3.2
Drawing the Abstraction
After the abstraction has been built, one must draw it in order to present a readable
image to the end-user. To draw an abstraction, there exist two strategies called top-
down and bottom-up. The top-down strategy consists of first drawing the abstraction
Search WWH ::

Custom Search