Information Technology Reference
In-Depth Information
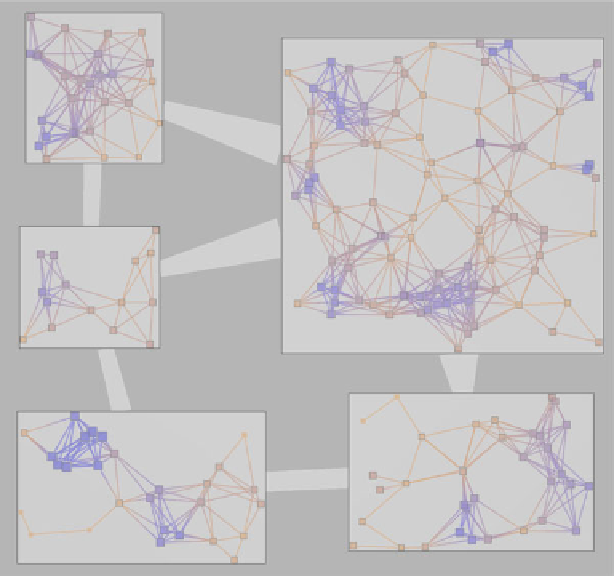
Fig. 5.4
A quotient graph consists of metanodes that themselves contain subgraphs. Links
between metanodes consist of the edges connecting the nodes in the underlying subgraphs. This
quotient graph is built from the graphs shown in the previous figures
bridges (edges with low centrality values) can be temporarily discarded, turning the
graph into disconnected components that all appear as communities and defined
clusters. The quotient graph can thus be formed where metanodes connect through
bridges. Note that this procedure can be repeated at will on each community to
provide a multilevel decomposition of the original graph, as suggested in Fig.
5.5
.
The procedure described here proceeds in a top-down manner, further decompos-
ing communities into sub-communities. Other algorithms proceed in a bottom-up
manner and build super-communities from smaller subgroups.
A number of questions can be addressed once a graph has been decomposed into
communities. Note that in the visual representation of a quotient graph (Figs.
5.4
and
5.5
), all edges connecting members of two distinct communities are abstracted as a
single higher-level edge. It is interesting, however, to study how clusters exchange
through their members. To this end, Guimerá, Mossa, Turtschi, and Amaral (
2005
)
introduced what they call the
participation coefficient
of a node. Before giving a
formal definition for this coefficient, we need to introduce some notation. Recall
that
d
G
(
v
)
denotes the degree of a node in a graph
G
(simply written as
d
(
v
)
when
G
is clear from context). Now, we denote as
d
C
i
(
v
)
the degree of a node in a cluster
Search WWH ::

Custom Search