Information Technology Reference
In-Depth Information
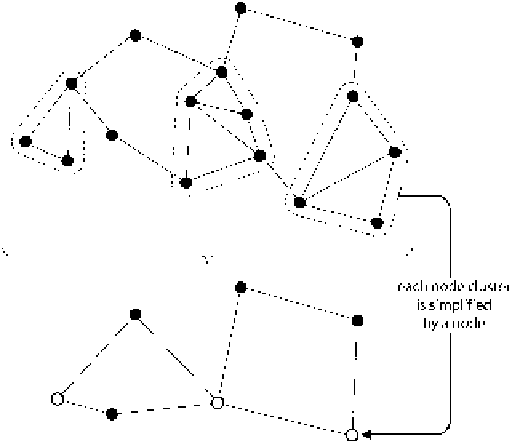
Fig. 3.5
Example of graph simplification by node clustering
because this research field needs graphs to model sets of people and the relationships
between them. Within these “social graphs”, the nodes and edges represent the
individuals and the relationships that they maintain. These relationships may have
different natures and concerns:
individual relationships (e.g., “I have made sb's acquaintance”) and group
relationships (“I work in the same company as sb”);
similarity relationships (“I speak the same language as sb”) and dissimilarity
relationships (“I was not born in the same country as sb”);
symmetric relationships (“I am related to sb”) and asymmetric relationships
(“I appreciate sb's company”);
binary relationships (“I am indebted to sb”) and quantitative (or “valuated”)
relationships (“I owe sb x euros”).
In such graphs, a relationship is basically modeled by an edge between the nodes
related to the individuals involved in the relationship. When considering group
relationships, the edges are drawn between each pair of individuals stemming from
the group.
However, some types of relationships demand more complex modeling:
asymmetrical relationships require work with directed graphs, i.e., with graphs
in which each edge connects an initial node to a final node;
quantitative relationships need to value the edges.
These models need to adapt the methods of analysis by considering the directions
and values of edges.
Search WWH ::

Custom Search