Information Technology Reference
In-Depth Information
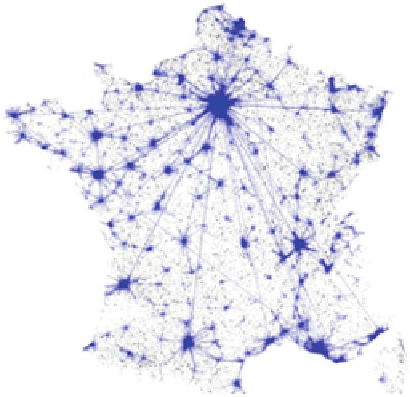
Fig. 12.15
Migration
network as scale free
Figure
12.14
b shows a plot of the log of the degree versus the log of the frequency
of that degree in the graph. If the degree distribution follows a power law, the data
should fit a straight line with a slope equal to the exponent y. As shown in the figure,
the commuter network appears to fit the power law distribution of degrees.
The high degree nodes in the commuter network often correspond to the major
cities in France. Where there exists a central node with a very high degree, we try to
detect these major cities and their star topology; the cities around it are often linked
to it directly.
We now present a recursive algorithm that helps to illustrate the polycentrism
in the commuter networks of France. The algorithm starts by checking to see if
the passed graph is scale free. If the graph is scale free, we then decompose the
graph into sub graphs using the nodes of highest degree in the network. If the graph
is not scale free, the algorithm uses the strength metric to color the edges of the
graph. The densely connected areas of the graph are highlighted in dark. Quite often,
these areas correspond to the regions of the graph that exhibit polycentric behavior
(Figs.
12.15
and
12.16
).
12.4.1
Visualizing Polycentric Structures
Using the Strength Metric
Although the commuter network for the most part is scale free, at the lower levels
of the multi-level decomposition, the graph can exhibit small world properties.
Because polycentric phenomena are more densely connected, they are more likely to
have small world properties. The strength metric is used to quantify the participation
of an edge in a cluster, and therefore, we can use the metric to assess whether or not
an edge participates in a strongly connected cluster.
Search WWH ::

Custom Search