Information Technology Reference
In-Depth Information
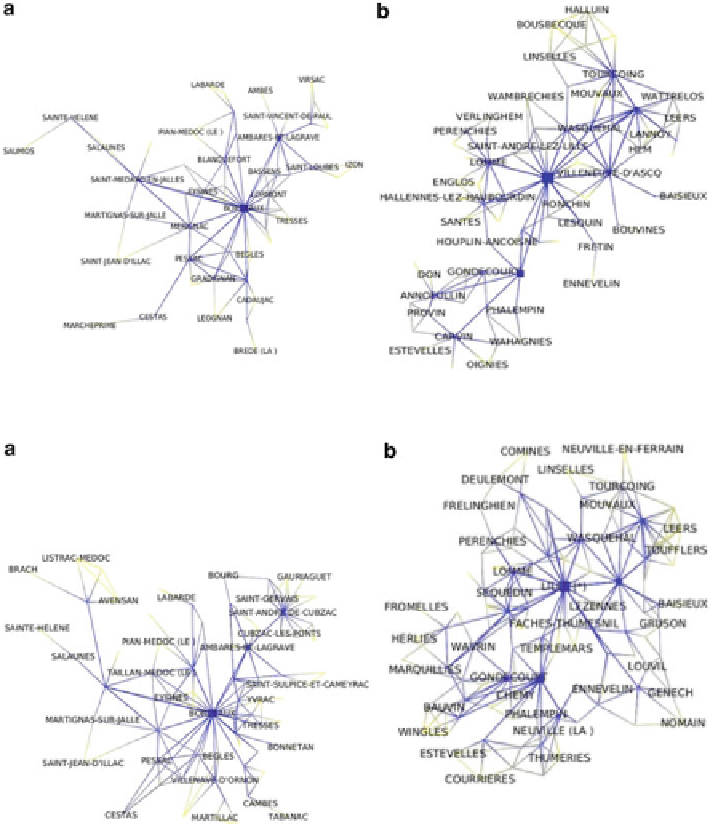
Fig. 12.4
Betweenness centrality index around Bordeaux (
a
) and Lille (
b
), year 1982
Fig. 12.5
Betweenness centrality index around Bordeaux (
a
) and Lille (
b
), year 1990
In these figures, the strength metric has been applied to the graphs. The color
of each edge indicates the connectivity of each region. The areas drawn darker are
tightly connected while the areas in pale are loosely connected.
12.3.1.3
Participation Coefficient
The participation coefficient measures the closure of the subnetworks as well as
the intensity of the sub-centralities according to the contribution and participation
indexes (
Melançon et al.
,
2008
). These indexes gauge the contribution of each
Search WWH ::

Custom Search