Information Technology Reference
In-Depth Information
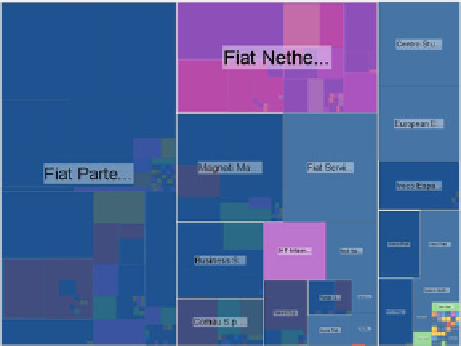
Fig. 7.13
ThesameDAGMapasinFig.
7.1
b, where the “strip” has a greater height. The
color
code
indicates that the tax havens on the left of Fig.
7.11
, themselves being subsidiaries of higher
level companies, are actually held by mother companies that are all located in Europe. Thus, there
may be a strategy on the part of European companies to control globalized subsidiaries through
“tax haven” subsidiaries (color figure online)
subsidiaries from different world regions end up in the same DAGMap cell.
Conversely, higher levels of the hierarchy represent the concentration of control on
European soil, revealing a pyramidal logic in the entire structure: headquarters at
the top of the pyramid, which relies on financial subsidiaries (2nd level) right
above a market structured by cultural (continental) differences (3rd level, mainly
involving European firms) and finally, an undifferentiated “world car” market at
the bottom spread over emergent countries.
Different extensions of this technique have been proposed for dealing with larger
hierarchies (
Koenig
,
2007
). Using focus+context techniques, the user can explore
the data using a specific interactor.
We also formally evaluated the combined DAGMap-Sugiyama technique versus
the Sugiyama technique alone and the DAGMap alone. The evaluation showed
that the DAGMap-Sugiyama visualization did not produce the best results but
represented the best compromise between the number of interactions and the task
completion time.
Our DAGMap visualization corresponds to a single view point showing low level
details. Currently, there is no animated transition when the view point changes. In
future work, an animated transition between two points of view in the DAGMap will
be designed.
Search WWH ::

Custom Search