Information Technology Reference
In-Depth Information
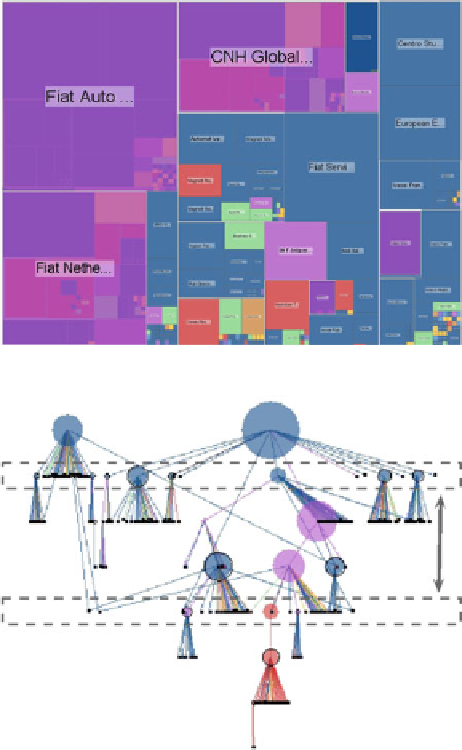
Fig. 7.11
The DAGMap
shown here is obtained from
that in Fig.
7.1
b, using the
“strip” (Fig.
7.12
). The
nesting of subsidiaries is
revealed by visualizing the
mother companies overlaying
the subsidiaries. Additionally,
the
color code
indicates that
these subsidiaries are held by
a mother company, which is
suspected to be a tax haven
(Fiat Netherland,
bottom left
;
CNH Global,
center row
)
(color figure online)
Fig. 7.12
The user can
define a strip positioned at a
certain level in the tree (the
unfolded DAG) and can
visualize the strip on the
DAGMap with superimposed
colored cells. Varying the
height of the strip provides
direct visual feedback on the
DAGMap (color figure
online)
were designed with expert geographers who were able to informally evaluate our
prototype.
By exploring the Fiat dataset with the combined DAGMap-Sugiyama visualization,
we were able to observe (and confirm) different strategies that have already been
identified by Porter (
Po rter
,
1986
): these strategies have been developed on a
continental level with Fiat, which most likely obeys a “car culture” differentiation.
Additionally, (Fiat) Europe appears to traditionally control the hierarchy, while
emergent South American countries occupy lower levels, thus confirming a
classical center-periphery schema (Porter).
Further analysis is needed to confirm the following results of the
DAGMap-Sugiyama visualization: the lower levels of the hierarchy obey a global
model, which may be linked to the development of the “world car”, explaining why
Search WWH ::

Custom Search