Information Technology Reference
In-Depth Information
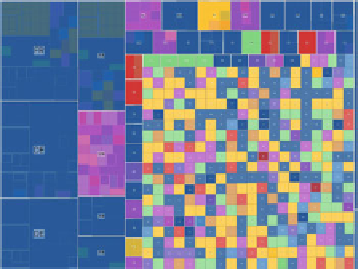
Fig. 7.10
Locating patterns
in node attributes (
color
/
area
)
is easier with the DagMap.
By overlaying higher level
cells on the DAGMap,
hypotheses can be
constructed on the potential
management strategies of
higher level companies (color
figure online)
Even when the DAG is sparse, the node-link diagram in Fig.
7.9
cannot be used
to analyze the distribution of subsidiaries over the regions of the world, or the ways
in which higher level companies control lower level subsidiaries. The computation
and interaction with the strip is designed to overcome this difficulty.
The strip is visualized using alpha values, by overlaying subsidiary cells by
ancestor cells (Fig.
7.11
). The mix of colors naturally indicates whether subsidiaries
are controlled by mid-level companies residing in the same region of the world, or
whether control is concentrated toward headquarters. When colors were mixed, indi-
cating that subsidiaries from different parts of the world were all controlled through
the same mother company, users suspected that the organization of companies relied
on by-product logic (as opposed to territorial logic).
By varying the strip height, the user obtains information about the attributes
of the ancestor cells and the size of their neighborhood. This functionality is
helpful when combined with color variation. Color coding was shown to be useful
with our test data, where the subsidiaries under the control of a suspected tax
haven company were highlighted (purple colored cells), as shown in Fig.
7.10
.In
other situations, geographers could directly see that the South American and/or
Asian subsidiaries occupying the lowest level of the hierarchy were controlled
by European headquarters. Compare, for instance, the left side of the DagMap in
Figs.
7.1
b,
7.12
,and
7.13
.
7.6
Conclusion
In this chapter, we presented the DAGMap as an extension of TreeMaps to directed
acyclic graphs or general hierarchies. The DAGMaps, together with the interactions
we described, were designed with the help of geographers. Our case study showed
that this combined view was particularly well-suited to our tasks. This was not
only because the dataset was intrinsically encoded as a DAG but also due to the
geographers' need for a visualization technique that astutely combines both the data
attributes and hierarchical structure into a single view. The technique and the tool
Search WWH ::

Custom Search