Information Technology Reference
In-Depth Information
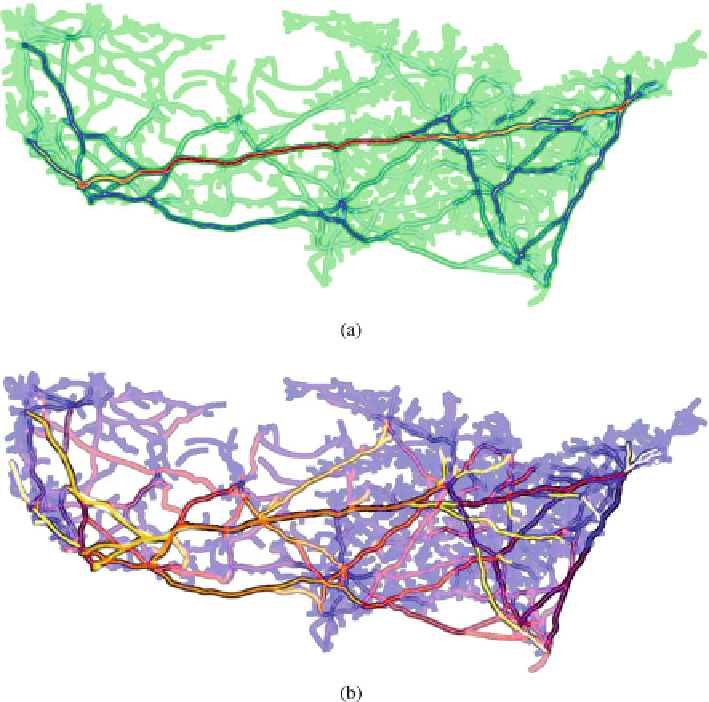
Fig. 6.11
Perceiving bundles densities with a bump mapping rendering technique. Edges are
rendered as cubic B-splines. (
a
) A splat field color mapping is used as a color map. (
b
) Original
edge colors are used as a color map (Color figure online)
To remove this clutter and to emphasize high-level edge patterns, the edges are
routed and grouped into bundles. Finally, rendering techniques such as bump
mapping are used to illustrate bundle densities.
References
Abello, J., van Ham, F., & Krishnan, N. (2006). Ask-graphview: A large scale graph visualization
system.
IEEE Transactions on Visualization and Computer Graphics
,
12
(5), 669-676.
Amiel, M., Rozenblat, C., & Melançon, G. (2005). Réseaux muti-niveaux: l'exemple des échanges
aériens mondiaux de passagers.
Mappemonde
,
79
(3). Retrieved July 21, 2009, from
http://
Search WWH ::

Custom Search