Information Technology Reference
In-Depth Information
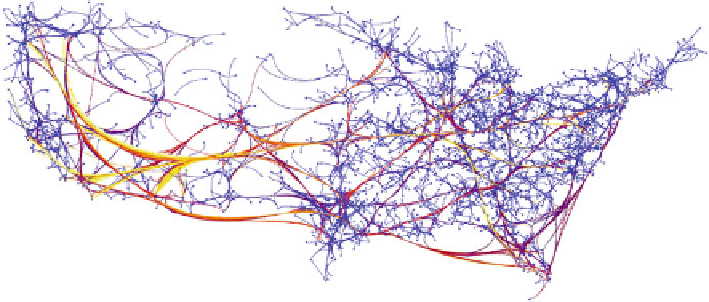
Fig. 6.10
Smoothing the edges of the graph from Fig.
6.9
with Bézier curves
and coherent bundles. Lambert et al. (
2010
) use this type of spline as well as others
such as Bézier curves or Catmull-Rom splines. Another method used by Holten and
Wijk (
2009
)andCuietal.(
2008
) is to apply a smoothing technique to the edges
that are drawn as polylines in order to morph them into curves. A rendering of the
same graph in Fig.
6.9
with edges drawn as Bézier curves is introduced in Fig.
6.10
for visual comparison.
Coloring Edges
Another method to enhance edge-bundled graph visualization is to use edge colors
and opacities to encode information. Edge colors are mapped to the directions of the
original links (
Cuietal.
,
2008
). In a similar technique, edge direction is encoded by
an interpolated color gradient running from a fixed color for the source to a fixed
color for the target (
Holten
,
2006
). Holten (
2006
) maps edge opacities to their length
where long curves are more transparent than short ones, which prevents short curves
from becoming obscured. Cui et al. (
2008
) use the opacity of each segment of the
polyline representing an edge to map the density of the lines overlapping it.
Perceiving Bundle Density
After graph edges have been bundled, some of the bundles share successive bends.
Consequently, several edge segments are merged into a single segment and the
information about the number of edges contained in a bundle is not readily visible in
the drawing. To distinguish strong bundles from weak ones, some techniques have
been designed to visually enhance the bundle strength. The first rendering technique
for estimating the quantity of merged edge segments is proposed by
Holten & Wijk
(
2009
). A GPU-based method is used to compute the amount of overdraw for each
Search WWH ::

Custom Search