what-when-how
In Depth Tutorials and Information
0.35
Conservative
Liberal
Neutral
0.3
0.25
0.2
0.15
0.1
0.05
0
−0.05
−0.1
0
0.1
0.2
0.3
0.4
x
1
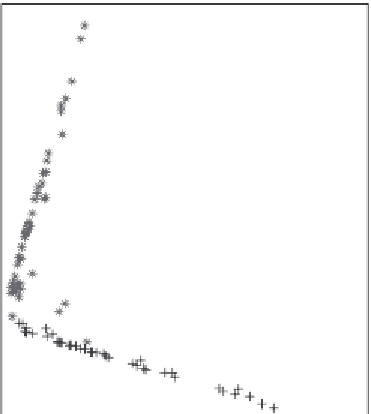
Figure4.2
The2-Dspectralgeometriesofthepoliticsbooksocialnetwork.
Figure 4.2 shows the 2-D spectral geometries of the politics book network data.
We can observe from Figure 4.2 that the majority of vertices projected in the 2-D
spectral space distribute along two straight and quasi-orthogonal lines. It indicates
that there exist two communities with sparse edges connecting them. he irst
uptrend line consists of most nodes in red color, while the second downtrend line
consists of most nodes in blue color. White nodes distribute either around the ori-
gin or between two quasi-orthogonal lines in the projected space.
4.3.2 Spectrum-Based Randomness Framework
In this section we present our framework that can quantify randomness at all gran-
ularity levels from edge node to the overall graph. We begin with a study of edge
nonrandomness by spectral coordinates of its two connected nodes in the spectral
space. We then define the node nonrandomness as the sum of nonrandomness
values of all edges that connect to it. Similarly, we define the overall graph non-
randomness as the sum of nonrandomness values of all edges within the the whole
graph. he formal deinition is as follows:
Definition 1.
1
.
Denote
α
u
= (
x
1u
,
x
2u
, …,
x
ku
) Î R
k
asthespectralcoordinateofnode
u,and
α
v
= (
x
1v
,
x
2v
, …,
x
kv
) Î R
k
asthespectralcoordinateofnodev
.