what-when-how
In Depth Tutorials and Information
220
200
180
160
140
120
100
80
60
40
Peers
Seeders
Leechers
20
0
0
2
4
6
8
10
12
14
16
18
Time (hours)
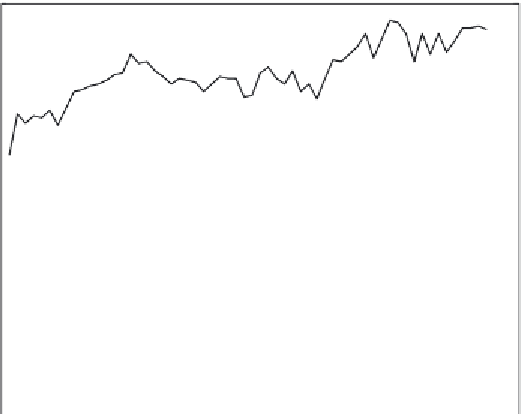
Figure6.2
Thenumberofpeersinthefeistytorrents.
transition from the transient stage to the steady stage as the experiment progressed.
However, there was a large influx of peers near the 12-hour mark, probably due to
a news posting.
Figure 6.3 shows three representative plots of the piece population in the feisty
torrent, as well as itted normal distributions. he piece population is seen to be
progressing towards a more normal distribution early in the experiment, although
it does increase in width towards the end of the experiment, as noted below by the
block variation.
he mean is progressing towards a value of 0.5. his can be clearly seen in
Figure 6.4, though somewhat noisy. Figure 6.5 shows the progression of the block
variation towards a more narrow distribution, reaching a minimum block variation
of 2
×
10
-4
. However, the width does increase by an order of magnitude near the
end of the experiment after the large influx of peers occurs.
6.2.1.3 Observation from Simulated PlanetLab Torrents
he controlled PlanetLab environment enables us to closely investigate the piece
population of a torrent in any period throughout its lifetime, and to introduce
interesting factors that it may be hard to find in real Internet torrents. We ran
several torrents on PlanetLab to investigate these possibilities. Now we show one


