what-when-how
In Depth Tutorials and Information
Infrastructure Capacity
Load and Generation
Information
Transport
Infrastructure
Capacity
Outage areas
User
Mobility
People,
locations,
activities,
infrastructure
information
Diseased
Population
Social Contacts
Constraints
People,
locations,
vehicles, device
ownership
Telecommunication
Activities
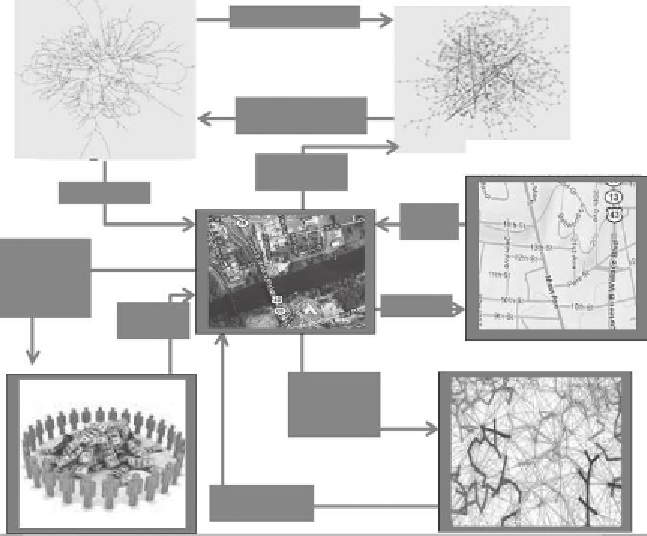
Figure5.11
Architectureandcomponentsoftheinterdependentsuiteofinfra-
structuresimulationsdevelopedatLosAlamosNationalLaboratory.Thesocial-
contacts network at the lower left is a fragment of the complete network and
isobtainedbylookingatasinglenode(center)andtracingtheircontactsupto
distance 3, which involves considering all nodes in the graph within distance
3. The wireless ad hoc network at the lower right is obtained by placing radio
transceiversalongcitystreets.Thebilateral-contractsnetworkattheupperright
showscontactsbetweensupplierandconsumerpairsinthecity.(FromC.Barrett
et al., Understanding large-scale social and infrastructure networks: A simula-
tion-basedapproach,
SIAM News
,Vol.37,No.4,pp.1-4,May2004.)
Usually, boorish-grained static structural analysis of sociotechnical networks is
combined with more complicated simulation-based dynamic analysis. he authors
believe that, together, these analyses provide useful insights for scientists, planning
personnel, and policy makers who need to incorporate specific operational goals
into their systems. he static structural analysis of sociotechnical networks shows
both interesting similarities and differences that arise from the way these networks
form and the functions they present.
To gain a clearer perception of the differences between these networks and
the applicability of different random graph models to such networks, one must
closely examine their properties. Table 5.1 presents a summary of some prominent