what-when-how
In Depth Tutorials and Information
140
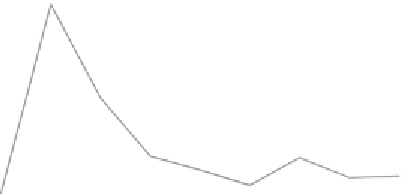
Predicted data
Real data
120
100
80
60
40
20
0
0
10
20
30
40
50
Time (Day)
Figure 5.4
Predicted and actual results from topic 2. (From Y. Zhou et al.,
Predictingthetendencyoftopicdiscussionontheonlinesocialnetworksusinga
dynamicprobabilitymodel,in
Conference on Hypertext and Hypermedia
,2008,
pp.7-11.)
80
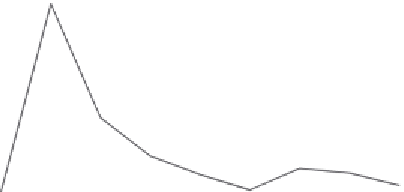
Predicted data
Real data
70
60
50
40
30
20
10
0
0
5
10
15
Time (Day)
20
25
30
Figure 5.5
Predicted and actual results from topic 3. (From Y. Zhou et al.,
Predictingthetendencyoftopicdiscussionontheonlinesocialnetworksusinga
dynamicprobabilitymodel,in
Conference on Hypertext and Hypermedia
,2008,
pp.7-11.)
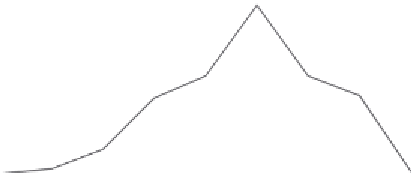
possible match between predicted and actual results, while Figures 5.3 and 5.5
show similar matches for most times, except for small periods of time where the
number of users diverges.
Since Figures 5.3-5.5 prove the validity of the probability model, the final
observation is that the experience parameters notably influence the output of the
function. hese three experience parameters are
s
,
s'
, and
λ
. For parameter
s
, a larger
value will cause the predicting result to properly coincide with the mean value of
the real data [1]. he proper value of
s
can be set according to the individual aim
of the model's application. Parameter
s'
determines the time constraints that the