what-when-how
In Depth Tutorials and Information
0.35
0.3
0.25
0.2
0.15
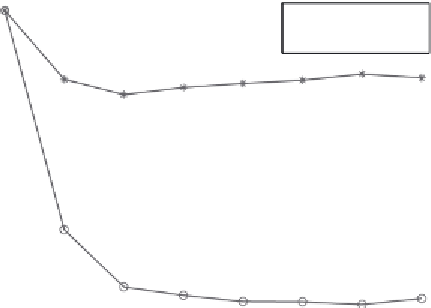
Rand switch
Spctr switch
0.1
0
50
100
150
200
k
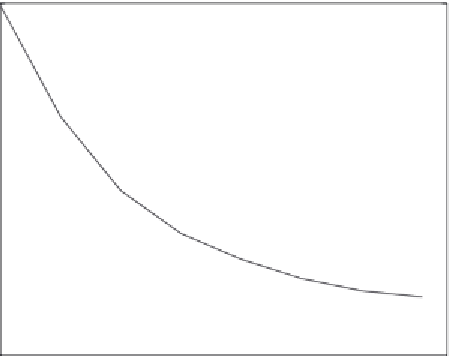
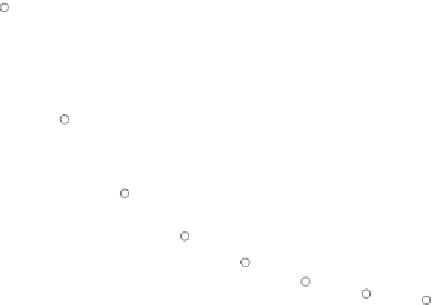
(e) Transitivity
2600
Rand switch
Spctr switch
2400
2200
2000
1800
1600
1400
1200
0
50
100
150
200
k
(f) Subgraph Centrality
Figure 4.5
Graph characteristic versus varying k between
Spctr Switch
and
Rand Switch.