Image Processing Reference
In-Depth Information
Fig. 4.29
Two gray-scale
images
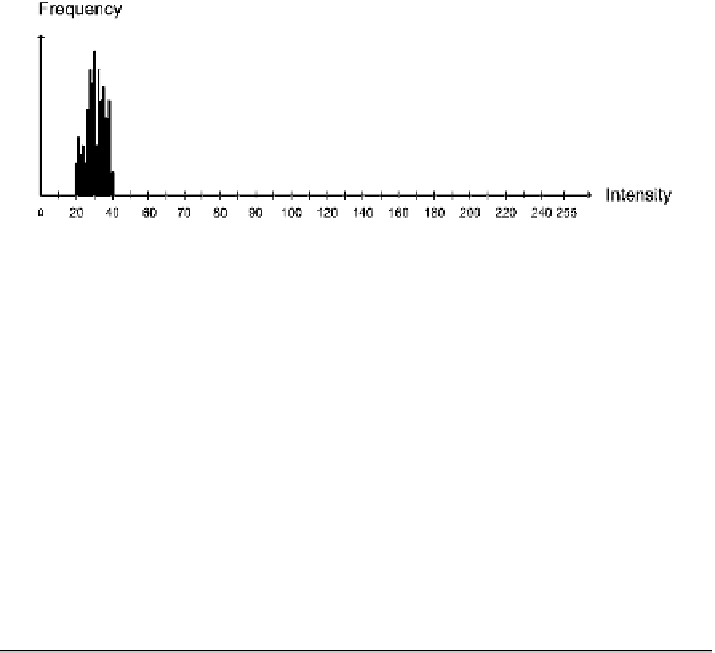
Fig. 4.30
The histogram of an image
be standing in front of a weather map. In reality the host is standing in front of a
green or blue screen and the background pixels are then replaced by pixels from the
weather map. Obviously, this only works when the color of the host's clothing is
different from the unique color used for covering the background.
When you as a designer have the freedom of defining the colors to be recognized
you can use the HSI color representation to select the most optimal colors. If you
only need one color, then you are free to choose, but when more colors are to be
thresholded, optimal basically means to pick colors most different and hence avoid
overlap. Looking at the HS circle in Fig. 3.11 you can see that the angle between
two colors should be 180° in order to minimize the risk of overlap. With three colors
you need to have 120° between the colors etc. Obviously this approach assumes you
can construct all possible color, which might not be realistic in a real-life situation.
4.9
Exercises
Exercise 1:
Explain the following concepts: point processing, brightness, contrast,
gray-level mapping, image histogram, thresholding, logic operations.
Exercise 2:
A linear gray-level mapping is performed on image
f
1
(x, y)
in
Fig.
4.29
where
a
15. What is the output value of
f
1
(
2
,
2
)
?
Exercise 3:
A gamma gray-level mapping is performed on image
f
1
(x, y)
in
Fig.
4.29
where
γ
=
1 and
b
=
0
.
45. What is the output value of
f
1
(
2
,
2
)
?
Exercise 4:
A logarithmic gray-level mapping is performed on image
f
1
(x, y)
in
Fig.
4.29
. What is the output value of
f
1
(
2
,
2
)
?
Exercise 5:
Given a histogram, how can the original gray-scale image be recreated?
=