Image Processing Reference
In-Depth Information
Fig. 4.22
Left
: Cropped image.
Center
: Histogram of input.
Right
: Thresholded image
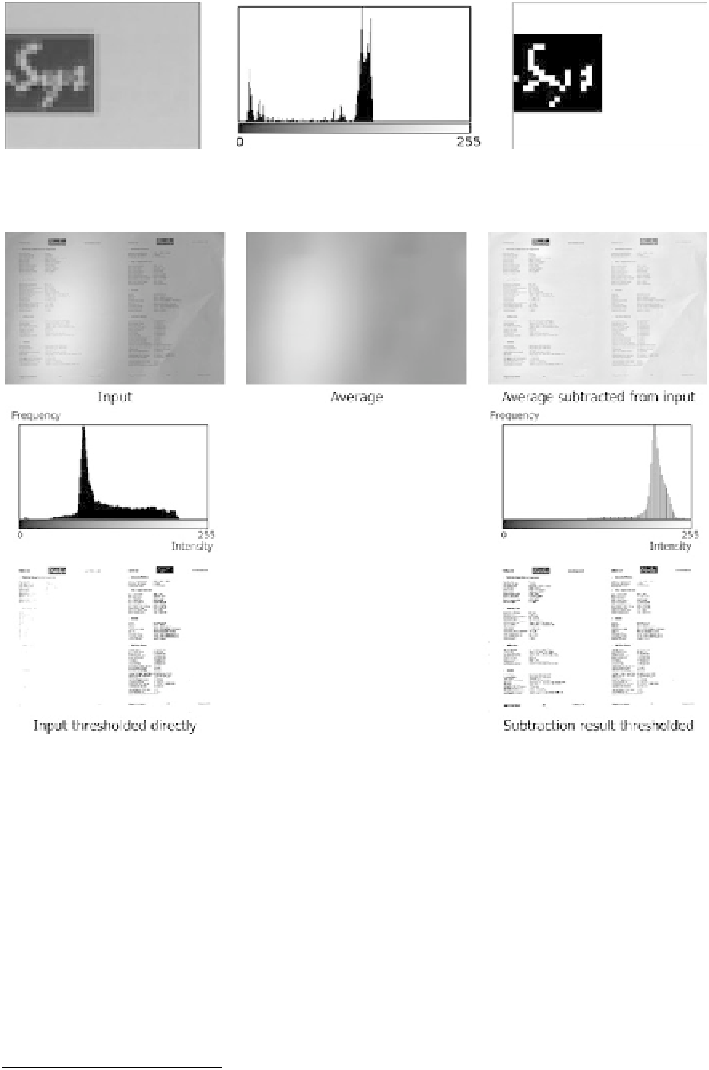
Fig. 4.23
Local automatic thresholding.
To p ro w
:
Left
: Input image.
Center
: Mean version of
input image.
Right
: Mean image subtracted from input.
Center row
: Histograms of input and mean
image subtracted from input.
Bottom row
: Thresholded images
els would stand out. We can estimate a background pixel by calculating the av-
erage of the neighboring pixels.
3
Doing this for all pixels will result in an esti-
mate of the background image, see Fig.
4.23
. We now subtract the input and the
background image and the result is an image with a more even illumination where
a global threshold value can be applied, see Fig.
4.23
.
4
Depending on the situa-
tion this could either be a fixed threshold value or an automatic value as describe
above.
3
How to calculate the average is discussed in the next chapter.
4
In the subtraction process both positive and negative values can appear. Since we are only inter-
ested in the difference we take the absolute value.